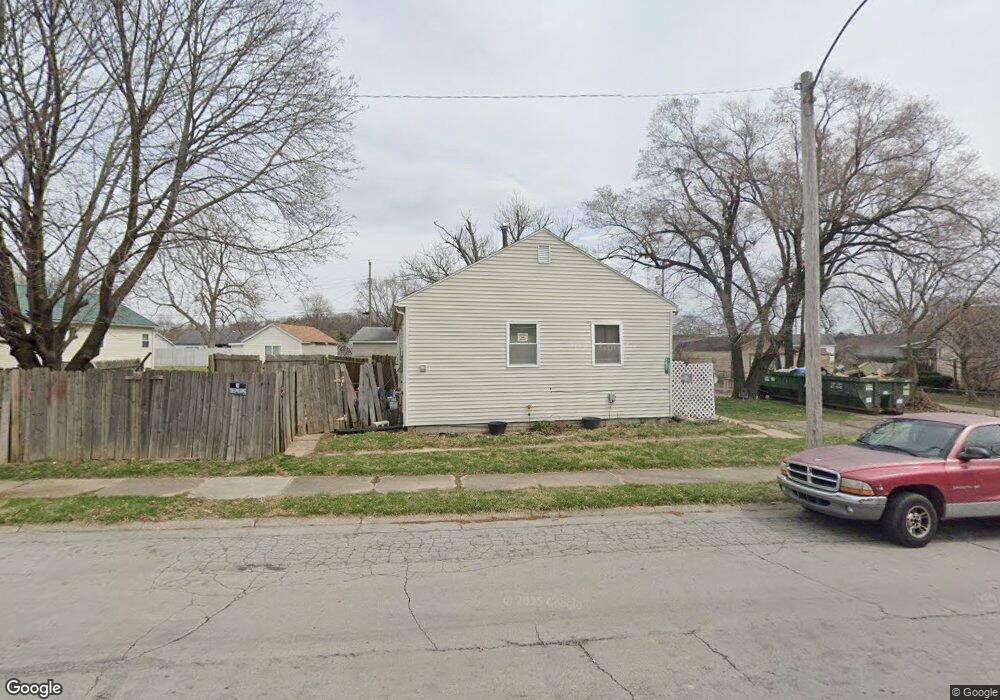
1600 East St Unit 1602 Springfield, OH 45505
Estimated Value: $69,000 - $153,000
4
Beds
2
Baths
1,425
Sq Ft
$72/Sq Ft
Est. Value
About This Home
This home is located at 1600 East St Unit 1602, Springfield, OH 45505 and is currently estimated at $102,308, approximately $71 per square foot. 1600 East St Unit 1602 is a home located in Clark County with nearby schools including Lincoln Elementary School, Hayward Middle School, and Springfield High School.
Ownership History
Date
Name
Owned For
Owner Type
Purchase Details
Closed on
Nov 3, 2009
Sold by
Fannie Mae
Bought by
Owens Dustin M and Owens Kathy
Current Estimated Value
Purchase Details
Closed on
Nov 21, 2008
Sold by
Young Carolyn R
Bought by
Fanniemae and Federal National Mortgage Association
Purchase Details
Closed on
Oct 23, 2003
Sold by
Jenks Jason C and Burgoyne Jenks Terri
Bought by
Young Lydell W and Young Carolyn R
Home Financials for this Owner
Home Financials are based on the most recent Mortgage that was taken out on this home.
Original Mortgage
$49,500
Interest Rate
6.23%
Mortgage Type
Purchase Money Mortgage
Purchase Details
Closed on
Sep 2, 1999
Sold by
Kearns Joyce C
Bought by
Mcenaney Timothy J and Mcenaney Luella S
Home Financials for this Owner
Home Financials are based on the most recent Mortgage that was taken out on this home.
Original Mortgage
$32,500
Interest Rate
10%
Mortgage Type
Seller Take Back
Create a Home Valuation Report for This Property
The Home Valuation Report is an in-depth analysis detailing your home's value as well as a comparison with similar homes in the area
Home Values in the Area
Average Home Value in this Area
Purchase History
| Date | Buyer | Sale Price | Title Company |
|---|---|---|---|
| Owens Dustin M | -- | Team Title & Closing Service | |
| Fanniemae | $25,000 | None Available | |
| Young Lydell W | $55,000 | Titlequest Agency Inc | |
| Mcenaney Timothy J | $42,500 | -- |
Source: Public Records
Mortgage History
| Date | Status | Borrower | Loan Amount |
|---|---|---|---|
| Previous Owner | Young Lydell W | $49,500 | |
| Previous Owner | Mcenaney Timothy J | $32,500 |
Source: Public Records
Tax History Compared to Growth
Tax History
| Year | Tax Paid | Tax Assessment Tax Assessment Total Assessment is a certain percentage of the fair market value that is determined by local assessors to be the total taxable value of land and additions on the property. | Land | Improvement |
|---|---|---|---|---|
| 2024 | $903 | $18,280 | $3,390 | $14,890 |
| 2023 | $903 | $18,280 | $3,390 | $14,890 |
| 2022 | $925 | $18,280 | $3,390 | $14,890 |
| 2021 | $828 | $15,060 | $2,750 | $12,310 |
| 2020 | $829 | $15,060 | $2,750 | $12,310 |
| 2019 | $832 | $15,060 | $2,750 | $12,310 |
| 2018 | $579 | $10,070 | $2,380 | $7,690 |
| 2017 | $579 | $10,066 | $2,380 | $7,686 |
| 2016 | $580 | $10,066 | $2,380 | $7,686 |
| 2015 | $656 | $11,169 | $2,503 | $8,666 |
| 2014 | $653 | $11,169 | $2,503 | $8,666 |
| 2013 | $646 | $11,169 | $2,503 | $8,666 |
Source: Public Records
Map
Nearby Homes
- 1435 Logan Ave
- 1519 Tibbetts Ave
- 550 E Rose St
- 551 Georgia Ave
- 1820 Clay St
- 1159 Selma Rd
- 1047 Cypress St
- 1111 Lafayette Ave
- 1102 Pine St
- 1024 Elder St
- 1018 Pine St
- 902 Cypress St
- 127 Rice St
- 1210 Burt St
- 1562 Rutland Ave
- 710-712 Cypress St
- 1754 S Fountain Ave
- 875 Gable St
- 705 York St
- 0 W Perrin Ave Unit 945728
- 1610 East St
- 1530 East St Unit 1532
- 1537 Logan Ave
- 1529 Logan Ave Unit 1531
- 858 Southfield Ave
- 1618 East St
- 1519 Logan Ave Unit 1521
- 1615 East St
- 1520 East St Unit 1522
- 1619 East St
- 1530 Logan Ave
- 857 Southfield Ave Unit 859
- 1518 Logan Ave Unit 1520
- 849 Southfield Ave Unit 851
- 1510 East St
- 1627 East St Unit 1629
- 1507 Logan Ave
- 843 Southfield Ave
- 1514 Logan Ave Unit 1516
- 837 Southfield Ave