Estimated Value: $4,230,000 - $5,274,000
5
Beds
6
Baths
3,764
Sq Ft
$1,255/Sq Ft
Est. Value
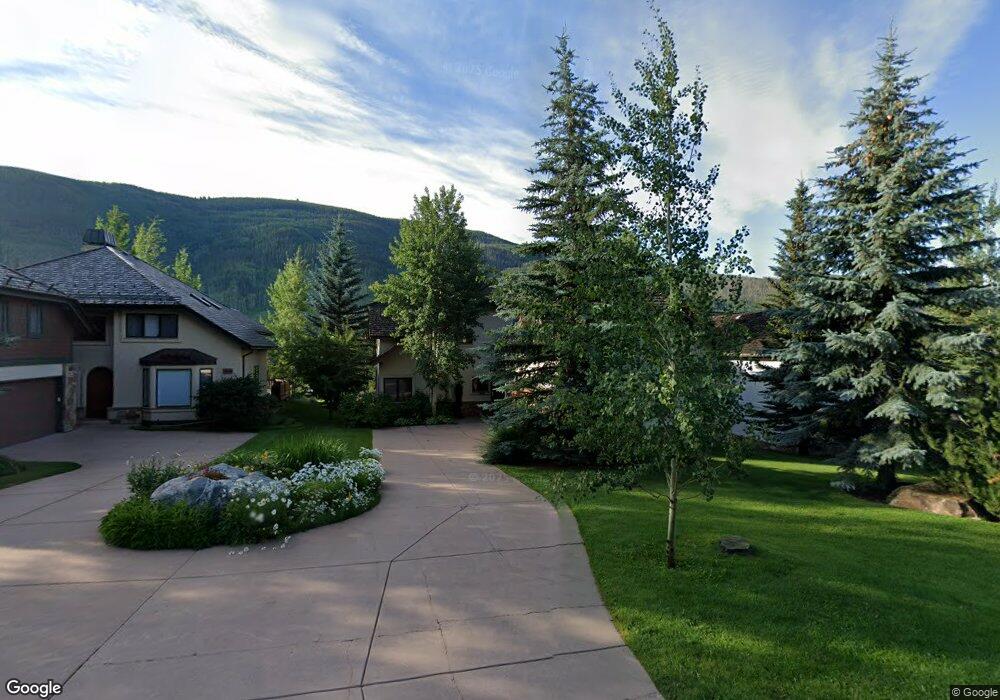
About This Home
This home is located at 1600 Lions Ridge Loop, Vail, CO 81657 and is currently estimated at $4,723,315, approximately $1,254 per square foot. 1600 Lions Ridge Loop is a home located in Eagle County with nearby schools including Red Sandstone Elementary School and Battle Mountain High School.
Ownership History
Date
Name
Owned For
Owner Type
Purchase Details
Closed on
Nov 4, 2003
Sold by
Shiffrin Jeffrey S
Bought by
Forst Tracy J and Forst Stephanie G
Current Estimated Value
Home Financials for this Owner
Home Financials are based on the most recent Mortgage that was taken out on this home.
Original Mortgage
$968,450
Outstanding Balance
$405,590
Interest Rate
4.62%
Mortgage Type
Purchase Money Mortgage
Estimated Equity
$4,317,725
Purchase Details
Closed on
Feb 23, 2001
Sold by
Omeah Ltd Partnership
Bought by
Shiffrin Jeffrey S
Purchase Details
Closed on
Jan 15, 1997
Sold by
Dauphinais Moseley Construction Inc
Bought by
Omeah Ltd Partnership
Home Financials for this Owner
Home Financials are based on the most recent Mortgage that was taken out on this home.
Original Mortgage
$720,000
Interest Rate
7.43%
Create a Home Valuation Report for This Property
The Home Valuation Report is an in-depth analysis detailing your home's value as well as a comparison with similar homes in the area
Home Values in the Area
Average Home Value in this Area
Purchase History
| Date | Buyer | Sale Price | Title Company |
|---|---|---|---|
| Forst Tracy J | $1,383,500 | Land Title | |
| Shiffrin Jeffrey S | $1,250,000 | Land Title | |
| Omeah Ltd Partnership | $900,000 | Land Title |
Source: Public Records
Mortgage History
| Date | Status | Borrower | Loan Amount |
|---|---|---|---|
| Open | Forst Tracy J | $968,450 | |
| Previous Owner | Omeah Ltd Partnership | $720,000 |
Source: Public Records
Tax History
| Year | Tax Paid | Tax Assessment Tax Assessment Total Assessment is a certain percentage of the fair market value that is determined by local assessors to be the total taxable value of land and additions on the property. | Land | Improvement |
|---|---|---|---|---|
| 2024 | $13,081 | $275,020 | $45,170 | $229,850 |
| 2023 | $13,081 | $275,020 | $45,170 | $229,850 |
| 2022 | $8,260 | $160,730 | $34,990 | $125,740 |
| 2021 | $8,505 | $165,360 | $36,000 | $129,360 |
| 2020 | $8,196 | $161,500 | $32,140 | $129,360 |
| 2019 | $8,223 | $161,500 | $32,140 | $129,360 |
| 2018 | $7,028 | $135,290 | $32,360 | $102,930 |
| 2017 | $6,994 | $135,290 | $32,360 | $102,930 |
| 2016 | $6,677 | $130,580 | $31,490 | $99,090 |
Source: Public Records
Map
Nearby Homes
- 1400 Lions Ridge Loop Unit 5
- 1874 Glacier Ct Unit B
- 1854 Glacier Ct Unit A
- 1890 Lions Ridge Loop Unit 11
- 1476 Westhaven Dr Unit 20
- 1476 Westhaven Dr Unit 22
- 1677 Buffehr Creek Rd
- 1488 Blue Rose Ln Unit B2
- 1488 Blue Rose Ln Unit A3
- 1488 Blue Rose Ln Unit C3
- 1488 Blue Rose Ln Unit A1
- 1488 Blue Rose Ln Unit B1
- 1455 Greenhill Ct Unit West
- 1360 Westhaven Dr Unit 5A
- 1459 Greenhill Ct Unit B
- 1454 Greenhill Ct Unit E
- 1461 Greenhill Ct Unit A and B
- 1359 Greenhill Ct Unit E
- 1452 Buffehr Creek Rd
- 1285 Westhaven Cir
- 1550 Lions Ridge Loop
- 1650 Lions Ridge Loop
- 1500 Lions Ridge Loop
- 1700 Lions Ridge Loop
- 1450 Lions Ridge Loop
- 1750 Lions Ridge Loop
- 1416 Moraine Dr
- 1414 Moraine Dr
- 1418 Moraine Dr
- 1410 Moraine Dr
- 1403 Moraine Dr
- 1495 Lions Ridge Loop
- 1773 Lions Ridge Loop
- 1800 Lions Ridge Loop
- 1420 Moraine Dr
- 1408 Moraine Dr
- 1475 Lions Ridge Loop Unit W
- 1475 Lions Ridge Loop Unit E
- 1475 Lions Ridge Loop Unit W 1/2
- 1475 Lions Ridge Loop
Your Personal Tour Guide
Ask me questions while you tour the home.