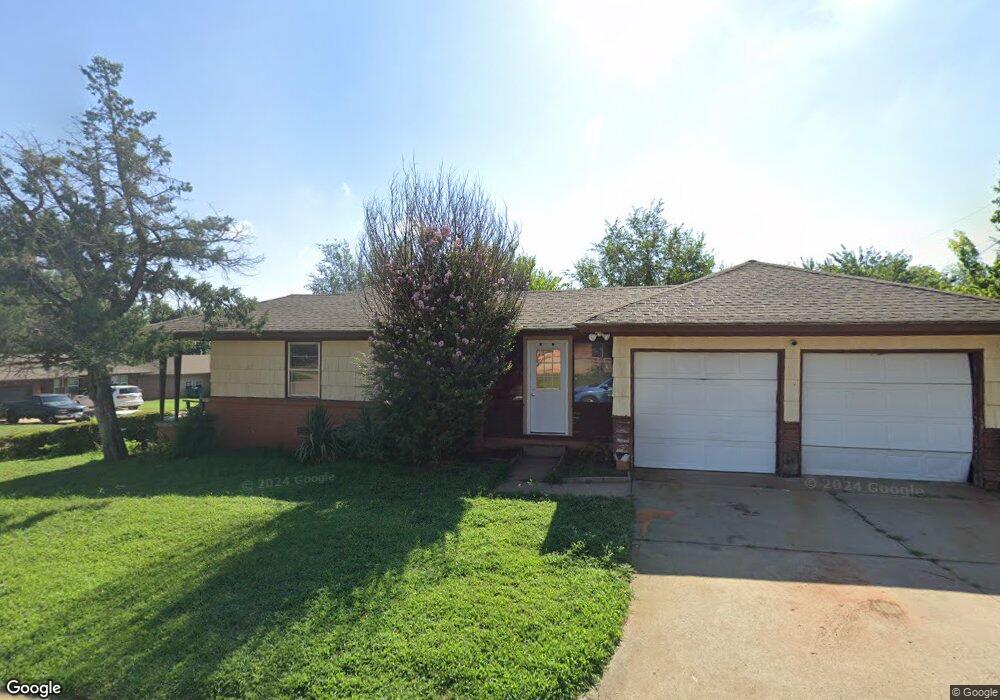
1600 NE 39th St Oklahoma City, OK 73111
South Park Estates NeighborhoodEstimated Value: $120,000 - $152,000
3
Beds
1
Bath
1,212
Sq Ft
$108/Sq Ft
Est. Value
About This Home
This home is located at 1600 NE 39th St, Oklahoma City, OK 73111 and is currently estimated at $131,413, approximately $108 per square foot. 1600 NE 39th St is a home located in Oklahoma County with nearby schools including M.L. King Jr. Elementary School, Parkview School - Levelland, and Moon Middle School.
Ownership History
Date
Name
Owned For
Owner Type
Purchase Details
Closed on
Sep 6, 2013
Sold by
Nolan Harvey and Wendover Financial Services
Bought by
Federal National Mortgage Association
Current Estimated Value
Purchase Details
Closed on
Jul 19, 2000
Sold by
Nolan Harvey
Bought by
Nolan Kathryn and Nolan Harvey
Create a Home Valuation Report for This Property
The Home Valuation Report is an in-depth analysis detailing your home's value as well as a comparison with similar homes in the area
Home Values in the Area
Average Home Value in this Area
Purchase History
| Date | Buyer | Sale Price | Title Company |
|---|---|---|---|
| Federal National Mortgage Association | -- | None Available | |
| Nolan Kathryn | -- | -- |
Source: Public Records
Tax History Compared to Growth
Tax History
| Year | Tax Paid | Tax Assessment Tax Assessment Total Assessment is a certain percentage of the fair market value that is determined by local assessors to be the total taxable value of land and additions on the property. | Land | Improvement |
|---|---|---|---|---|
| 2024 | $349 | $2,980 | $397 | $2,583 |
| 2023 | $349 | $2,839 | $78 | $2,761 |
| 2022 | $318 | $2,703 | $129 | $2,574 |
| 2021 | $303 | $2,575 | $125 | $2,450 |
| 2020 | $292 | $2,453 | $143 | $2,310 |
| 2019 | $278 | $2,336 | $152 | $2,184 |
| 2018 | $253 | $2,226 | $0 | $0 |
| 2017 | $240 | $2,118 | $123 | $1,995 |
| 2016 | $229 | $2,017 | $122 | $1,895 |
| 2015 | $220 | $1,922 | $208 | $1,714 |
| 2014 | $208 | $1,830 | $187 | $1,643 |
Source: Public Records
Map
Nearby Homes
- 1320 NE 40th St
- 4108 Park Ln
- 3512 N Rhode Island Ave
- 1237 Staton Dr
- 1233 Staton Dr
- 1714 NE 34th St
- 1212 Campbell Rd
- 1437 NE 33rd St
- 0 N Prospect Ave
- 4115 N Everest Ave
- 1517 NE 45th St
- 4435 N Martin Luther King Ave
- 1309 NE 46th St
- 1709 Meyers Place
- 3600 Springlake Dr
- 3600 N Laird Ave
- 1901 NE 28th St
- 846 Marilyn St
- 1812 NE 49th St
- 1435 NE 27th St
- 1604 NE 39th St
- 1548 NE 39th St
- 1608 NE 39th St
- 1601 NE 38th St
- 1605 NE 38th St
- 1612 NE 39th St
- 1609 NE 38th St
- 1544 NE 39th St
- 3913 Sharry Ln
- 1601 NE 39th St
- 1605 NE 39th St
- 1553 NE 39th St
- 1613 NE 38th St
- 3909 Sharry Ln
- 1616 NE 39th St
- 1609 NE 39th St
- 1540 NE 39th St
- 1549 NE 39th St
- 1613 NE 39th St
- 1617 NE 38th St