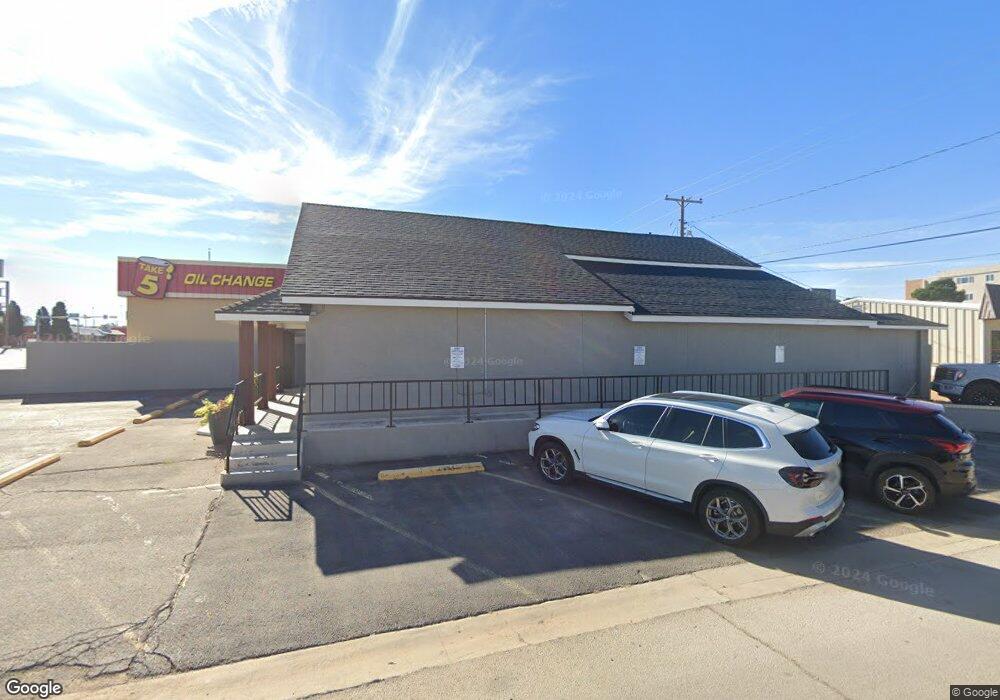
1600 S Gregg St Big Spring, TX 79720
--
Bed
--
Bath
7,105
Sq Ft
7,710
Sq Ft Lot
About This Home
This home is located at 1600 S Gregg St, Big Spring, TX 79720. 1600 S Gregg St is a home located in Howard County with nearby schools including Big Spring High School, St. Mary's Episcopal School, and Nazarene Christian Academy Big Spring.
Ownership History
Date
Name
Owned For
Owner Type
Purchase Details
Closed on
Feb 16, 2024
Sold by
Wendland Larson Christie
Bought by
Rpcp 1958 Llc
Home Financials for this Owner
Home Financials are based on the most recent Mortgage that was taken out on this home.
Original Mortgage
$125,975
Outstanding Balance
$97,443
Interest Rate
6.66%
Mortgage Type
New Conventional
Purchase Details
Closed on
Feb 18, 2016
Sold by
Larson Trevis
Bought by
Larson Christie
Purchase Details
Closed on
Mar 20, 2015
Sold by
Rav Investments Llc
Bought by
Larson Trevis Lee and Larson Christie Wendland
Home Financials for this Owner
Home Financials are based on the most recent Mortgage that was taken out on this home.
Original Mortgage
$166,940
Interest Rate
3.6%
Mortgage Type
Commercial
Purchase Details
Closed on
May 26, 2005
Sold by
Brown Ricky Lynn and Brown Angela
Bought by
Newell Connie S
Create a Home Valuation Report for This Property
The Home Valuation Report is an in-depth analysis detailing your home's value as well as a comparison with similar homes in the area
Home Values in the Area
Average Home Value in this Area
Purchase History
| Date | Buyer | Sale Price | Title Company |
|---|---|---|---|
| Rpcp 1958 Llc | -- | Surety Title | |
| Rpcp 1958 Llc | -- | Surety Title | |
| Larson Christie | $166,940 | None Available | |
| Larson Trevis Lee | -- | None Available | |
| Newell Connie S | -- | None Available |
Source: Public Records
Mortgage History
| Date | Status | Borrower | Loan Amount |
|---|---|---|---|
| Open | Rpcp 1958 Llc | $125,975 | |
| Closed | Rpcp 1958 Llc | $125,975 | |
| Previous Owner | Larson Trevis Lee | $166,940 |
Source: Public Records
Tax History Compared to Growth
Tax History
| Year | Tax Paid | Tax Assessment Tax Assessment Total Assessment is a certain percentage of the fair market value that is determined by local assessors to be the total taxable value of land and additions on the property. | Land | Improvement |
|---|---|---|---|---|
| 2024 | $3,363 | $189,007 | $38,500 | $150,507 |
| 2023 | $3,332 | $189,040 | $38,500 | $150,540 |
| 2022 | $3,855 | $188,842 | $38,500 | $150,342 |
| 2021 | $4,056 | $172,580 | $38,500 | $134,080 |
| 2020 | $5,065 | $213,035 | $38,500 | $174,535 |
| 2019 | $5,233 | $206,855 | $38,500 | $168,355 |
| 2018 | $6,261 | $208,986 | $38,500 | $170,486 |
| 2017 | $6,202 | $210,701 | $38,500 | $172,201 |
| 2016 | $6,264 | $212,828 | $38,500 | $174,328 |
| 2015 | -- | $214,953 | $38,500 | $176,453 |
| 2014 | -- | $150,000 | $38,500 | $111,500 |
Source: Public Records
Map
Nearby Homes
- 1513 Scurry St
- 1308 Scurry St Unit A,B,C,D,E
- 405 Edwards Blvd
- 1903 S Main St
- 1305 Pennsylvania Ave
- 702 W 18th St
- 1606 Johnson St
- 801 W 15th St
- 1801 Johnson St
- 1204 Pennsylvania Ave
- 803 W 14th St
- 1906 Johnson St
- 601 Edwards Blvd
- 0 Interstate 20
- 0 Nix Rd
- 2101 Runnels St
- 107 W 10th St
- 1405 Nolan St
- 501 E 15th St
- 509 Westover Rd
- 1603 S Lancaster St
- 1513 S Lancaster St
- 1605 S Lancaster St
- 1511 S Lancaster St
- 1509 S Lancaster St
- 310 W 17th St
- 1507 S Lancaster St
- 1606 S Lancaster St
- 1505 S Lancaster St
- 1701 S Lancaster St
- 1501 S Lancaster St
- 1508 Scurry St
- 1504 S Lancaster St
- 1506 Scurry St
- 207 W 17th St
- 1502 S Lancaster St
- 1502 Scurry St
- 1500 S Lancaster St
- 308 W 15th St
- 1601 Scurry St