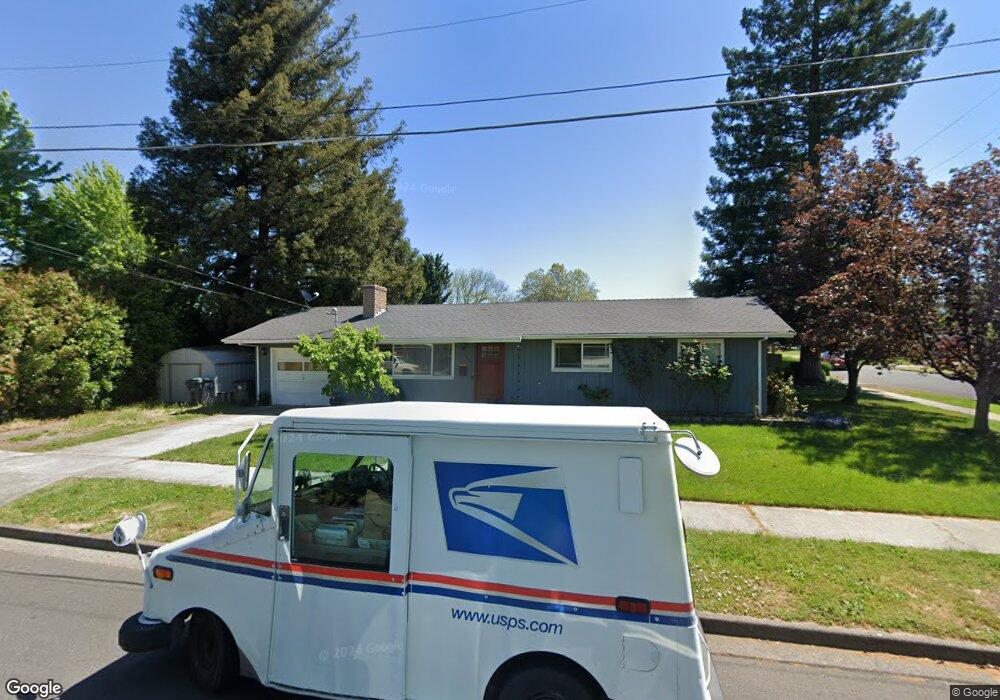
1600 Serenity Dr Unit 2 Medford, OR 97504
Estimated Value: $317,000 - $335,000
3
Beds
1
Bath
1,056
Sq Ft
$308/Sq Ft
Est. Value
About This Home
This home is located at 1600 Serenity Dr Unit 2, Medford, OR 97504 and is currently estimated at $325,676, approximately $308 per square foot. 1600 Serenity Dr Unit 2 is a home located in Jackson County with nearby schools including Wilson Elementary School, Hedrick Middle School, and North Medford High School.
Ownership History
Date
Name
Owned For
Owner Type
Purchase Details
Closed on
Sep 26, 2011
Sold by
Federal National Mortgage Association
Bought by
Matthews Owen and Matthews Michelle
Current Estimated Value
Home Financials for this Owner
Home Financials are based on the most recent Mortgage that was taken out on this home.
Original Mortgage
$110,135
Outstanding Balance
$75,080
Interest Rate
4.09%
Mortgage Type
FHA
Estimated Equity
$250,596
Purchase Details
Closed on
Aug 9, 2011
Sold by
Taylor Jason E and Taylor Misty B
Bought by
Federal National Mortgage Association
Home Financials for this Owner
Home Financials are based on the most recent Mortgage that was taken out on this home.
Original Mortgage
$110,135
Outstanding Balance
$75,080
Interest Rate
4.09%
Mortgage Type
FHA
Estimated Equity
$250,596
Purchase Details
Closed on
Mar 1, 2004
Sold by
Mayben Michael D and Mayben Anita K
Bought by
Taylor Jason E and Taylor Misty B
Home Financials for this Owner
Home Financials are based on the most recent Mortgage that was taken out on this home.
Original Mortgage
$127,200
Interest Rate
4.87%
Mortgage Type
Purchase Money Mortgage
Create a Home Valuation Report for This Property
The Home Valuation Report is an in-depth analysis detailing your home's value as well as a comparison with similar homes in the area
Home Values in the Area
Average Home Value in this Area
Purchase History
| Date | Buyer | Sale Price | Title Company |
|---|---|---|---|
| Matthews Owen | $113,000 | Ticor Title Company Oregon | |
| Federal National Mortgage Association | $192,552 | None Available | |
| Taylor Jason E | $159,000 | Ticor Title |
Source: Public Records
Mortgage History
| Date | Status | Borrower | Loan Amount |
|---|---|---|---|
| Open | Matthews Owen | $110,135 | |
| Previous Owner | Taylor Jason E | $127,200 | |
| Closed | Taylor Jason E | $23,850 |
Source: Public Records
Tax History Compared to Growth
Tax History
| Year | Tax Paid | Tax Assessment Tax Assessment Total Assessment is a certain percentage of the fair market value that is determined by local assessors to be the total taxable value of land and additions on the property. | Land | Improvement |
|---|---|---|---|---|
| 2025 | $2,417 | $166,680 | $66,610 | $100,070 |
| 2024 | $2,417 | $161,830 | $64,660 | $97,170 |
| 2023 | $2,343 | $157,120 | $62,780 | $94,340 |
| 2022 | $2,286 | $157,120 | $62,780 | $94,340 |
| 2021 | $2,227 | $152,550 | $60,960 | $91,590 |
| 2020 | $2,180 | $148,110 | $59,190 | $88,920 |
| 2019 | $2,129 | $139,620 | $55,800 | $83,820 |
| 2018 | $2,074 | $135,560 | $54,180 | $81,380 |
| 2017 | $2,037 | $135,560 | $54,180 | $81,380 |
| 2016 | $2,050 | $127,790 | $51,070 | $76,720 |
| 2015 | $1,971 | $127,790 | $51,070 | $76,720 |
| 2014 | $1,936 | $120,460 | $48,140 | $72,320 |
Source: Public Records
Map
Nearby Homes
- 1744 Concord Way
- 2030 Brookhurst St Unit 28
- 2000 Brookhurst St Unit 2
- 2000 Brookhurst St Unit 1
- 1441 Larkspur Ave
- 1588 Nordic Ct
- 1215 Covina Ave
- 1512 Nordic Ct
- 1228 Corona Ave
- 2010 Crater Lake Ave
- 1917 Hybiscus St
- 1225 Corona Ave
- 2058 Roberts Rd
- 2076 Roberts Rd Unit TL2000
- 2076 Roberts Rd
- 1411 E McAndrews Rd
- 3626 Ford Dr
- 2217 Jubilant Ave
- 2009 Grandview Ave
- 2424 Crater Lake Ave
- 1711 Johnson St
- 1610 Serenity Dr
- 1716 Concord Way
- 1721 Johnson St
- 1601 Serenity Dr
- 1700 Johnson St
- 1692 Johnson St
- 1609 Serenity Dr
- 1722 Concord Way
- 1710 Johnson St
- 1731 Johnson St
- 1720 Johnson St
- 1672 Johnson St
- 1728 Concord Way
- 1701 Serenity Dr
- 1681 Grand Ave
- 1651 Johnson St
- 1730 Johnson St
- 1709 Concord Way