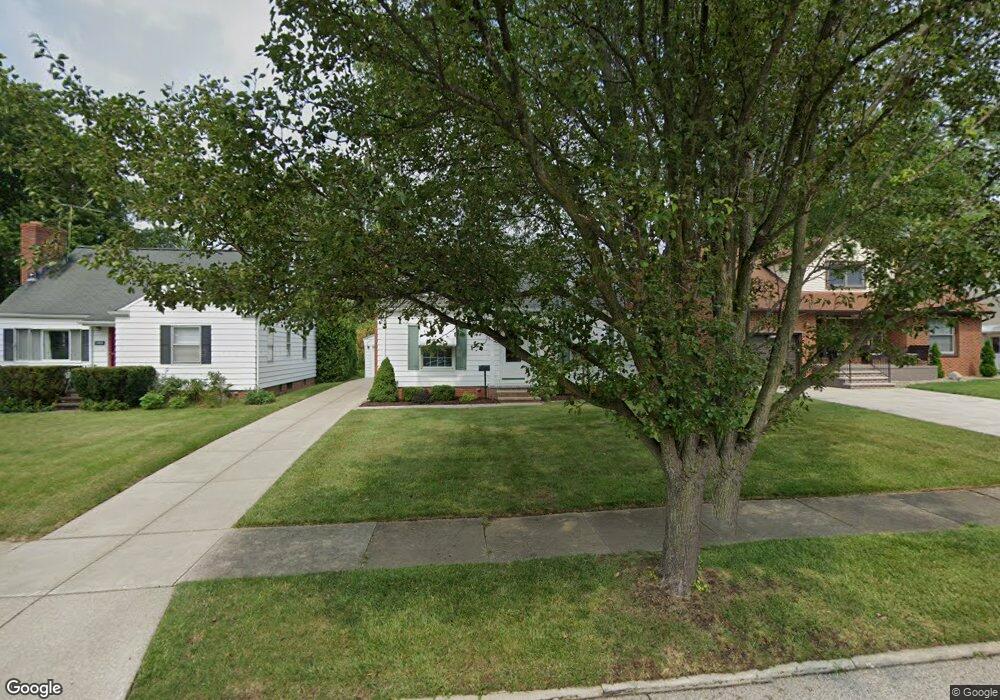
16000 Glenridge Ave Middleburg Heights, OH 44130
Estimated Value: $213,282 - $260,000
3
Beds
1
Bath
1,272
Sq Ft
$192/Sq Ft
Est. Value
About This Home
This home is located at 16000 Glenridge Ave, Middleburg Heights, OH 44130 and is currently estimated at $244,571, approximately $192 per square foot. 16000 Glenridge Ave is a home located in Cuyahoga County with nearby schools including Big Creek Elementary School, Berea-Midpark Middle School, and Berea-Midpark High School.
Ownership History
Date
Name
Owned For
Owner Type
Purchase Details
Closed on
Mar 4, 2019
Sold by
Jencson Daniel E and Jencson Ruth C
Bought by
Jencson Ruth C
Current Estimated Value
Purchase Details
Closed on
Aug 30, 1993
Sold by
Zach Sandra Ann
Bought by
Jencson Daniel E
Purchase Details
Closed on
Jul 13, 1992
Sold by
Haire William J
Bought by
Zach Sandra Ann
Purchase Details
Closed on
Jul 31, 1987
Sold by
Mcdowell Donald James
Bought by
Haire William J
Purchase Details
Closed on
May 19, 1987
Sold by
Neeson Thomas
Bought by
Mcdowell Donald James
Purchase Details
Closed on
Mar 17, 1987
Sold by
Neeson Thomas
Bought by
Neeson Thomas
Purchase Details
Closed on
Jan 24, 1985
Sold by
Neeson Thomas and Neeson Lila
Bought by
Neeson Thomas
Purchase Details
Closed on
Jan 1, 1975
Bought by
Neeson Thomas and Neeson Lila
Create a Home Valuation Report for This Property
The Home Valuation Report is an in-depth analysis detailing your home's value as well as a comparison with similar homes in the area
Home Values in the Area
Average Home Value in this Area
Purchase History
| Date | Buyer | Sale Price | Title Company |
|---|---|---|---|
| Jencson Ruth C | -- | None Available | |
| Jencson Daniel E | $85,900 | -- | |
| Zach Sandra Ann | $89,000 | -- | |
| Haire William J | $73,900 | -- | |
| Mcdowell Donald James | $70,000 | -- | |
| Neeson Thomas | -- | -- | |
| Neeson Thomas | -- | -- | |
| Neeson Thomas | -- | -- |
Source: Public Records
Tax History Compared to Growth
Tax History
| Year | Tax Paid | Tax Assessment Tax Assessment Total Assessment is a certain percentage of the fair market value that is determined by local assessors to be the total taxable value of land and additions on the property. | Land | Improvement |
|---|---|---|---|---|
| 2024 | $3,260 | $71,750 | $14,245 | $57,505 |
| 2023 | $2,770 | $52,430 | $11,830 | $40,600 |
| 2022 | $2,777 | $52,430 | $11,830 | $40,600 |
| 2021 | $2,761 | $52,430 | $11,830 | $40,600 |
| 2020 | $2,523 | $43,720 | $9,870 | $33,850 |
| 2019 | $2,452 | $124,900 | $28,200 | $96,700 |
| 2018 | $2,442 | $43,720 | $9,870 | $33,850 |
| 2017 | $2,306 | $39,140 | $9,000 | $30,140 |
| 2016 | $2,288 | $39,140 | $9,000 | $30,140 |
| 2015 | $2,009 | $39,140 | $9,000 | $30,140 |
| 2014 | $2,009 | $36,930 | $8,470 | $28,460 |
Source: Public Records
Map
Nearby Homes
- 15861 Glenridge Ave
- 7364 Pearl Rd
- 16365 Barriemore Ave
- 7470 Lanier Dr
- 7475 Lanier Dr
- 7381 Grant Blvd
- 7280 Pearl Rd
- 7254 Craigmere Dr
- 7221 Craigmere Dr
- 7446 Pinewood Dr
- 7400 Engle Rd
- 7344 Engle Rd
- 14280 Pawnee Trail
- 14270 Cherokee Trail
- 7685 Saratoga Rd
- 16475 Heather Ln Unit S202
- V/L Franke Rd
- 6689 Fry Rd
- 6943 N Parkway Dr Unit H6943
- 6809 Meadow Ln
- 16020 Glenridge Ave
- 15980 Glenridge Ave
- 16040 Glenridge Ave
- 15960 Glenridge Ave
- 16060 Glenridge Ave
- 15873 Parklawn Ave
- 15893 Parklawn Ave
- 15940 Glenridge Ave
- 15853 Parklawn Ave
- 15911 Parklawn Ave
- 15833 Parklawn Ave
- 16001 Glenridge Ave
- 16021 Glenridge Ave
- 15981 Glenridge Ave
- 15929 Parklawn Ave
- 15920 Glenridge Ave
- 16041 Glenridge Ave
- 15961 Glenridge Ave
- 16061 Glenridge Ave
- 15813 Parklawn Ave