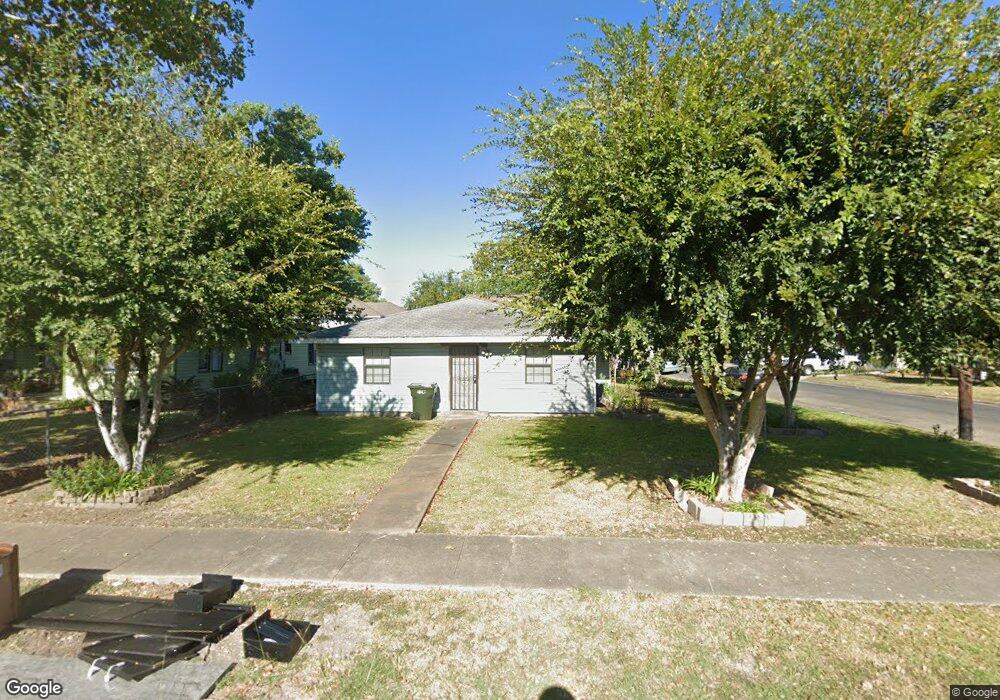
1601 6th Ave Port Arthur, TX 77642
Estimated Value: $132,725 - $174,000
--
Bed
--
Bath
2,446
Sq Ft
$60/Sq Ft
Est. Value
About This Home
This home is located at 1601 6th Ave, Port Arthur, TX 77642 and is currently estimated at $145,681, approximately $59 per square foot. 1601 6th Ave is a home located in Jefferson County with nearby schools including DeQueen Elementary School, Abraham Lincoln Middle School, and Memorial High School.
Ownership History
Date
Name
Owned For
Owner Type
Purchase Details
Closed on
Jan 21, 2020
Sold by
Larios Amada Mendoza
Bought by
Funenz Mendoza Juan Antonio and Funenz Santos
Current Estimated Value
Purchase Details
Closed on
May 6, 2014
Sold by
Funez Santos E
Bought by
Larios Amada Mendoza
Purchase Details
Closed on
May 7, 2001
Sold by
Tmomas James W
Bought by
Funez Santos E
Home Financials for this Owner
Home Financials are based on the most recent Mortgage that was taken out on this home.
Original Mortgage
$38,000
Interest Rate
1%
Mortgage Type
Seller Take Back
Create a Home Valuation Report for This Property
The Home Valuation Report is an in-depth analysis detailing your home's value as well as a comparison with similar homes in the area
Home Values in the Area
Average Home Value in this Area
Purchase History
| Date | Buyer | Sale Price | Title Company |
|---|---|---|---|
| Funenz Mendoza Juan Antonio | -- | None Available | |
| Larios Amada Mendoza | -- | None Available | |
| Funez Santos E | $40,000 | -- |
Source: Public Records
Mortgage History
| Date | Status | Borrower | Loan Amount |
|---|---|---|---|
| Previous Owner | Funez Santos E | $38,000 |
Source: Public Records
Tax History Compared to Growth
Tax History
| Year | Tax Paid | Tax Assessment Tax Assessment Total Assessment is a certain percentage of the fair market value that is determined by local assessors to be the total taxable value of land and additions on the property. | Land | Improvement |
|---|---|---|---|---|
| 2025 | $1,658 | $128,093 | -- | -- |
| 2024 | $1,658 | $116,448 | -- | -- |
| 2023 | $1,658 | $105,862 | $0 | $0 |
| 2022 | $3,056 | $96,238 | $0 | $0 |
| 2021 | $2,900 | $87,489 | $1,078 | $86,411 |
| 2020 | $2,139 | $64,552 | $1,078 | $63,474 |
| 2019 | $2,093 | $64,560 | $1,080 | $63,480 |
| 2018 | $1,938 | $60,820 | $1,080 | $59,740 |
| 2017 | $1,885 | $60,820 | $1,080 | $59,740 |
| 2016 | $1,782 | $60,820 | $1,080 | $59,740 |
| 2015 | $1,152 | $60,820 | $1,080 | $59,740 |
| 2014 | $1,152 | $50,952 | $1,080 | $59,740 |
Source: Public Records
Map
Nearby Homes