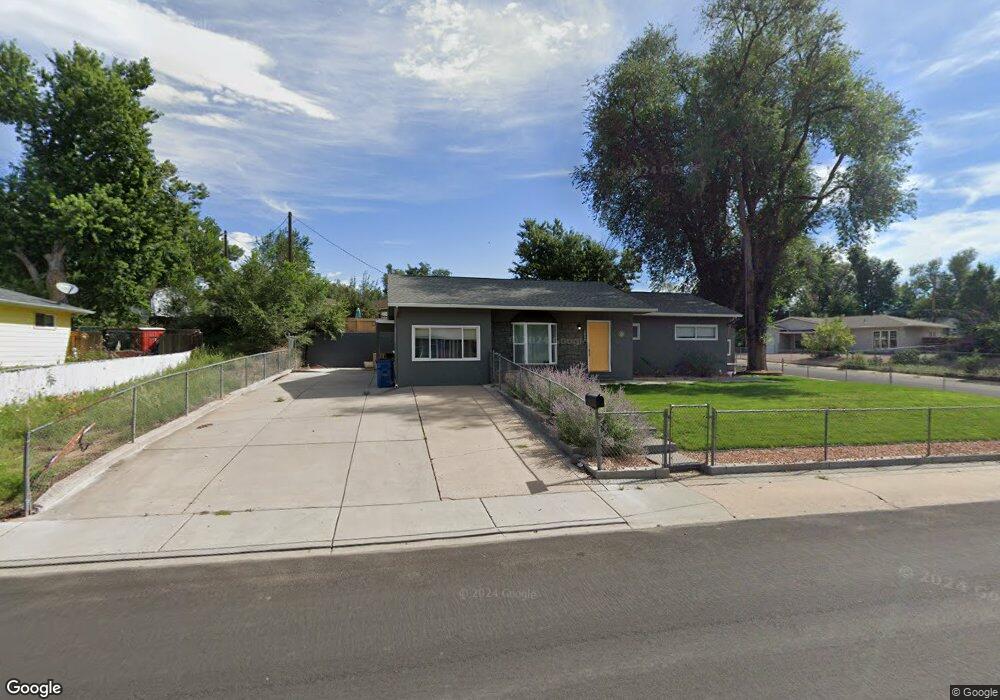
1601 Hallam Ave Colorado Springs, CO 80911
Security-Widefield NeighborhoodEstimated Value: $317,000 - $360,000
3
Beds
1
Bath
1,321
Sq Ft
$257/Sq Ft
Est. Value
About This Home
This home is located at 1601 Hallam Ave, Colorado Springs, CO 80911 and is currently estimated at $339,540, approximately $257 per square foot. 1601 Hallam Ave is a home located in El Paso County with nearby schools including Pinello Elementary School, Sproul Junior High School, and Widefield High School.
Ownership History
Date
Name
Owned For
Owner Type
Purchase Details
Closed on
Jun 21, 2019
Sold by
City Light Homes Llc
Bought by
Quackenbush Sophie G and Webb John W
Current Estimated Value
Home Financials for this Owner
Home Financials are based on the most recent Mortgage that was taken out on this home.
Original Mortgage
$265,590
Outstanding Balance
$233,045
Interest Rate
4%
Mortgage Type
VA
Estimated Equity
$106,495
Purchase Details
Closed on
Jan 31, 2019
Sold by
Secretary Of Veterans Affairs
Bought by
City Light Homes Llc
Purchase Details
Closed on
Dec 20, 2018
Sold by
Wells Fargo Bank Na
Bought by
Secretary Of Veterans Affairs and Department Of Veterans Affairs
Purchase Details
Closed on
May 18, 2017
Sold by
Lewis Denny D
Bought by
Pizzuto Kaleb M
Home Financials for this Owner
Home Financials are based on the most recent Mortgage that was taken out on this home.
Original Mortgage
$199,192
Interest Rate
4.1%
Mortgage Type
VA
Purchase Details
Closed on
Mar 21, 2014
Sold by
Lewis Denny D and Lewis Robin L
Bought by
Lewis Denny D
Purchase Details
Closed on
Dec 7, 2001
Sold by
Harper Helene Elisabeth and Harper Helene E
Bought by
Lewis Denny D and Lewis Robin L
Home Financials for this Owner
Home Financials are based on the most recent Mortgage that was taken out on this home.
Original Mortgage
$108,605
Interest Rate
6.41%
Mortgage Type
FHA
Purchase Details
Closed on
Dec 22, 2000
Sold by
Harper Helene E
Bought by
Lewis Denny D and Lewis Robin L
Home Financials for this Owner
Home Financials are based on the most recent Mortgage that was taken out on this home.
Original Mortgage
$82,822
Interest Rate
7.78%
Mortgage Type
FHA
Purchase Details
Closed on
May 3, 1993
Bought by
Pizzuto Kaleb M
Purchase Details
Closed on
Apr 2, 1990
Bought by
Pizzuto Kaleb M
Purchase Details
Closed on
Oct 1, 1989
Bought by
Pizzuto Kaleb M
Purchase Details
Closed on
Dec 1, 1979
Bought by
Pizzuto Kaleb M
Create a Home Valuation Report for This Property
The Home Valuation Report is an in-depth analysis detailing your home's value as well as a comparison with similar homes in the area
Home Values in the Area
Average Home Value in this Area
Purchase History
| Date | Buyer | Sale Price | Title Company |
|---|---|---|---|
| Quackenbush Sophie G | $260,000 | Heritage Title Company | |
| City Light Homes Llc | $173,000 | None Available | |
| Secretary Of Veterans Affairs | -- | None Available | |
| Pizzuto Kaleb M | $195,000 | Capstone Title | |
| Lewis Denny D | -- | None Available | |
| Lewis Denny D | -- | Stewart Title | |
| Lewis Denny D | -- | Stewart Title | |
| Pizzuto Kaleb M | $45,000 | -- | |
| Pizzuto Kaleb M | $47,500 | -- | |
| Pizzuto Kaleb M | -- | -- | |
| Pizzuto Kaleb M | -- | -- |
Source: Public Records
Mortgage History
| Date | Status | Borrower | Loan Amount |
|---|---|---|---|
| Open | Quackenbush Sophie G | $265,590 | |
| Previous Owner | Pizzuto Kaleb M | $199,192 | |
| Previous Owner | Lewis Denny D | $108,605 | |
| Previous Owner | Lewis Denny D | $82,822 |
Source: Public Records
Tax History Compared to Growth
Tax History
| Year | Tax Paid | Tax Assessment Tax Assessment Total Assessment is a certain percentage of the fair market value that is determined by local assessors to be the total taxable value of land and additions on the property. | Land | Improvement |
|---|---|---|---|---|
| 2025 | $1,494 | $23,900 | -- | -- |
| 2024 | $1,433 | $23,890 | $4,020 | $19,870 |
| 2023 | $1,433 | $23,890 | $4,020 | $19,870 |
| 2022 | $1,261 | $16,890 | $2,780 | $14,110 |
| 2021 | $1,360 | $17,380 | $2,860 | $14,520 |
| 2020 | $1,129 | $14,010 | $2,500 | $11,510 |
| 2019 | $1,122 | $14,010 | $2,500 | $11,510 |
| 2018 | $874 | $10,180 | $1,870 | $8,310 |
| 2017 | $884 | $10,180 | $1,870 | $8,310 |
| 2016 | $727 | $10,230 | $1,990 | $8,240 |
| 2015 | $745 | $10,230 | $1,990 | $8,240 |
| 2014 | $690 | $9,510 | $1,790 | $7,720 |
Source: Public Records
Map
Nearby Homes