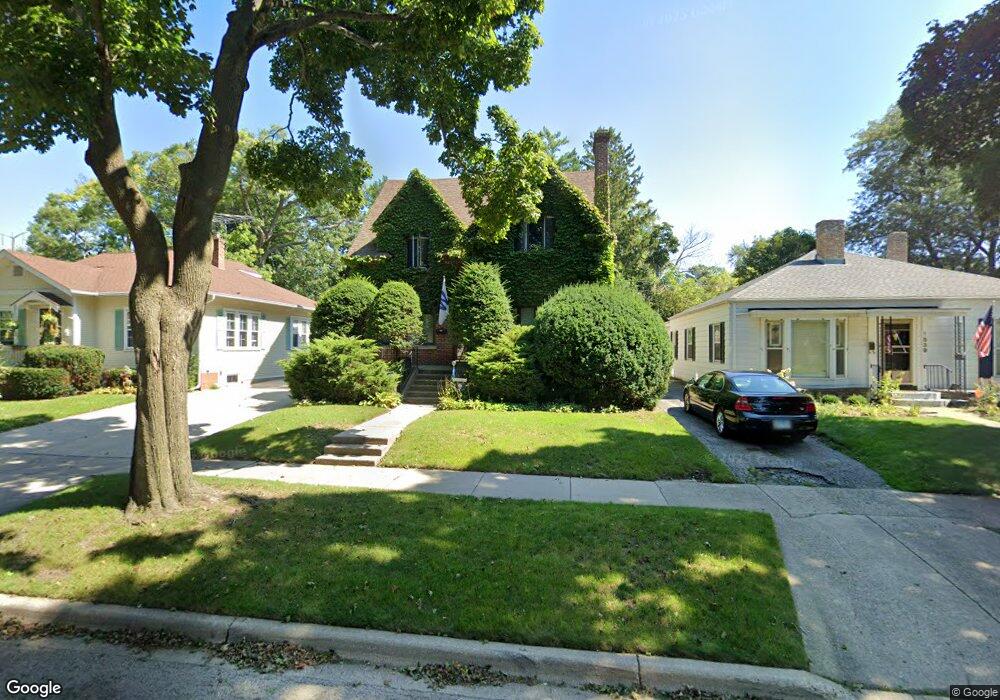
1601 Henry Place Waukegan, IL 60085
Estimated Value: $263,000 - $334,000
3
Beds
2
Baths
2,168
Sq Ft
$139/Sq Ft
Est. Value
About This Home
This home is located at 1601 Henry Place, Waukegan, IL 60085 and is currently estimated at $301,477, approximately $139 per square foot. 1601 Henry Place is a home located in Lake County with nearby schools including Greenwood Elementary School, Edith M Smith Middle School, and Waukegan High School.
Ownership History
Date
Name
Owned For
Owner Type
Purchase Details
Closed on
Dec 28, 2004
Sold by
Bucher John A and Bucher Martha R
Bought by
Reed Michael D and Reed Sara A
Current Estimated Value
Home Financials for this Owner
Home Financials are based on the most recent Mortgage that was taken out on this home.
Original Mortgage
$167,400
Outstanding Balance
$83,761
Interest Rate
5.82%
Mortgage Type
Purchase Money Mortgage
Estimated Equity
$217,716
Purchase Details
Closed on
Jun 27, 1994
Sold by
Hill Philip M and Hill Anna M
Bought by
Bucher John A and Bucher Martha R
Home Financials for this Owner
Home Financials are based on the most recent Mortgage that was taken out on this home.
Original Mortgage
$123,000
Interest Rate
8.78%
Create a Home Valuation Report for This Property
The Home Valuation Report is an in-depth analysis detailing your home's value as well as a comparison with similar homes in the area
Home Values in the Area
Average Home Value in this Area
Purchase History
| Date | Buyer | Sale Price | Title Company |
|---|---|---|---|
| Reed Michael D | $186,000 | -- | |
| Bucher John A | $142,500 | -- |
Source: Public Records
Mortgage History
| Date | Status | Borrower | Loan Amount |
|---|---|---|---|
| Open | Reed Michael D | $167,400 | |
| Previous Owner | Bucher John A | $123,000 |
Source: Public Records
Tax History Compared to Growth
Tax History
| Year | Tax Paid | Tax Assessment Tax Assessment Total Assessment is a certain percentage of the fair market value that is determined by local assessors to be the total taxable value of land and additions on the property. | Land | Improvement |
|---|---|---|---|---|
| 2024 | $6,824 | $86,642 | $9,055 | $77,587 |
| 2023 | $5,977 | $78,139 | $8,167 | $69,972 |
| 2022 | $5,977 | $70,939 | $6,797 | $64,142 |
| 2021 | $5,588 | $63,371 | $6,061 | $57,310 |
| 2020 | $5,614 | $59,038 | $5,647 | $53,391 |
| 2019 | $5,592 | $54,099 | $5,175 | $48,924 |
| 2018 | $4,862 | $43,985 | $7,324 | $36,661 |
| 2017 | $4,682 | $38,915 | $6,480 | $32,435 |
| 2016 | $4,298 | $33,816 | $5,631 | $28,185 |
| 2015 | $4,099 | $30,266 | $5,040 | $25,226 |
| 2014 | $4,474 | $31,985 | $5,827 | $26,158 |
| 2012 | $5,765 | $34,653 | $6,313 | $28,340 |
Source: Public Records
Map
Nearby Homes
- 1613 North Ave
- 616 W Keith Ave
- 1336 N Ash St
- 1335 Chestnut St
- 1018 W Atlantic Ave
- 1110 N Ash St
- 1905 Linden Ave
- 415 W Ridgeland Ave
- 1312 N Linden Ave
- 918 N Ash St
- 1105 Woodlawn Cir
- 2213 Alta Vista Dr
- 723 N County St
- 2246 Alta Vista Dr
- 917 N Linden Ave
- 1504 W Glen Flora Ave
- 2232 Walnut St
- 325 4th St
- 1000 Pine St
- 1109 Massena Ave
- 1539 Henry Place
- 1605 Henry Place
- 1609 Henry Place
- 1535 Henry Place
- 1604 Alexander Ct
- 1534 Alexander Ct
- 1529 Henry Place
- 1611 Henry Place
- 1608 Alexander Ct
- 1532 Alexander Ct
- 1528 Alexander Ct
- 320 Harding Ave
- 1612 Alexander Ct
- 1613 Henry Place
- 1606 Henry Place
- 1608 Henry Place
- 1534 Henry Place
- 1610 Henry Place
- 1532 Henry Place
- 306 Harding Ave