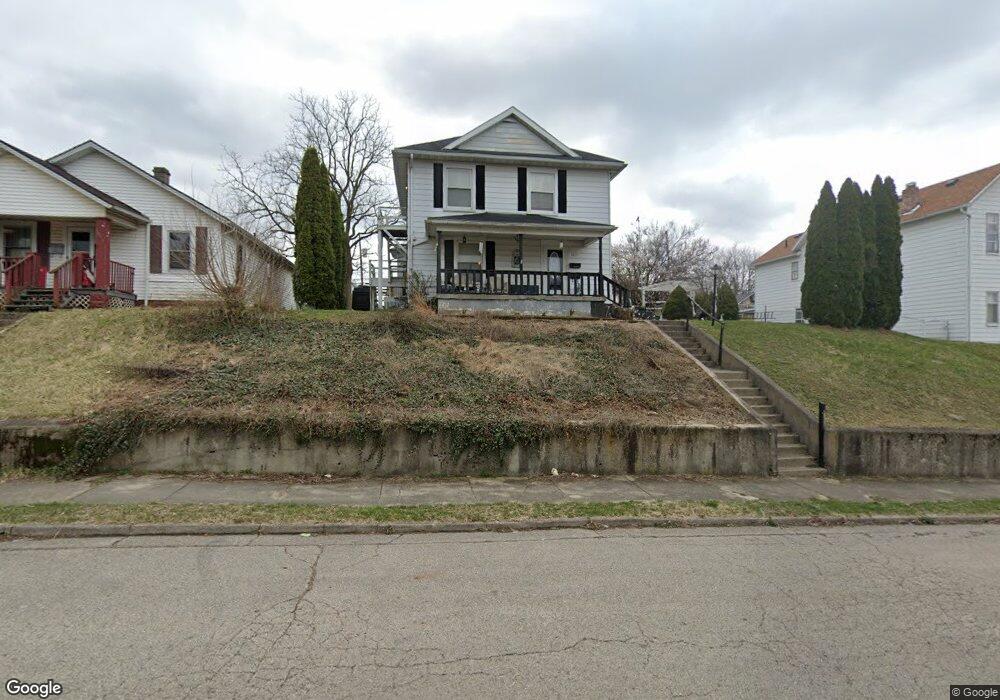
1601 Morgan St Unit 1601 1/2 Springfield, OH 45503
Estimated Value: $83,000 - $119,367
3
Beds
2
Baths
1,664
Sq Ft
$62/Sq Ft
Est. Value
About This Home
This home is located at 1601 Morgan St Unit 1601 1/2, Springfield, OH 45503 and is currently estimated at $103,592, approximately $62 per square foot. 1601 Morgan St Unit 1601 1/2 is a home located in Clark County with nearby schools including Warder Park-Wayne Elementary School, Schaefer Middle School, and Springfield High School.
Ownership History
Date
Name
Owned For
Owner Type
Purchase Details
Closed on
Nov 5, 2012
Sold by
Shaffer Lula Belle and Shaffer William R
Bought by
Harvey Beth G
Current Estimated Value
Home Financials for this Owner
Home Financials are based on the most recent Mortgage that was taken out on this home.
Original Mortgage
$53,512
Outstanding Balance
$36,855
Interest Rate
3.32%
Mortgage Type
FHA
Estimated Equity
$66,737
Purchase Details
Closed on
Mar 23, 1994
Create a Home Valuation Report for This Property
The Home Valuation Report is an in-depth analysis detailing your home's value as well as a comparison with similar homes in the area
Home Values in the Area
Average Home Value in this Area
Purchase History
| Date | Buyer | Sale Price | Title Company |
|---|---|---|---|
| Harvey Beth G | $54,500 | Ohio Real Estate Title | |
| -- | -- | -- |
Source: Public Records
Mortgage History
| Date | Status | Borrower | Loan Amount |
|---|---|---|---|
| Open | Harvey Beth G | $53,512 |
Source: Public Records
Tax History Compared to Growth
Tax History
| Year | Tax Paid | Tax Assessment Tax Assessment Total Assessment is a certain percentage of the fair market value that is determined by local assessors to be the total taxable value of land and additions on the property. | Land | Improvement |
|---|---|---|---|---|
| 2024 | $1,170 | $24,240 | $2,010 | $22,230 |
| 2023 | $1,170 | $24,240 | $2,010 | $22,230 |
| 2022 | $1,198 | $24,240 | $2,010 | $22,230 |
| 2021 | $1,112 | $20,760 | $1,700 | $19,060 |
| 2020 | $1,115 | $20,760 | $1,700 | $19,060 |
| 2019 | $1,117 | $20,760 | $1,700 | $19,060 |
| 2018 | $1,028 | $18,330 | $1,700 | $16,630 |
| 2017 | $1,027 | $18,326 | $1,701 | $16,625 |
| 2016 | $1,028 | $18,326 | $1,701 | $16,625 |
| 2015 | $1,049 | $18,326 | $1,701 | $16,625 |
| 2014 | $1,044 | $18,326 | $1,701 | $16,625 |
| 2013 | $1,033 | $18,326 | $1,701 | $16,625 |
Source: Public Records
Map
Nearby Homes