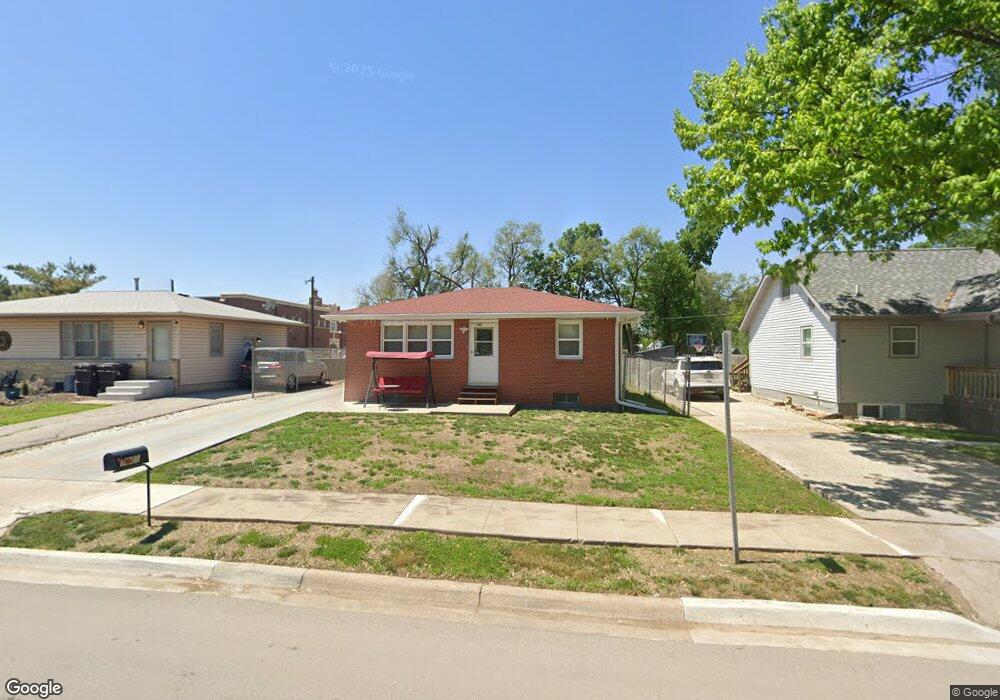
1601 N 31st St Lincoln, NE 68503
Clinton NeighborhoodEstimated Value: $189,000 - $224,000
2
Beds
2
Baths
1,375
Sq Ft
$150/Sq Ft
Est. Value
About This Home
This home is located at 1601 N 31st St, Lincoln, NE 68503 and is currently estimated at $206,907, approximately $150 per square foot. 1601 N 31st St is a home located in Lancaster County with nearby schools including Clinton Elementary School, C. Culler Middle School, and Lincoln Northeast High School.
Ownership History
Date
Name
Owned For
Owner Type
Purchase Details
Closed on
Mar 16, 2010
Sold by
Osmanovic Dzevahira
Bought by
Osmanovic Sanela and Osmanovic Mirzet
Current Estimated Value
Purchase Details
Closed on
Jan 25, 2001
Sold by
Glanz Sherri L
Bought by
Osmanovic Saban and Osmanovic Dzevahira
Home Financials for this Owner
Home Financials are based on the most recent Mortgage that was taken out on this home.
Original Mortgage
$73,400
Interest Rate
7.21%
Mortgage Type
FHA
Create a Home Valuation Report for This Property
The Home Valuation Report is an in-depth analysis detailing your home's value as well as a comparison with similar homes in the area
Home Values in the Area
Average Home Value in this Area
Purchase History
| Date | Buyer | Sale Price | Title Company |
|---|---|---|---|
| Osmanovic Sanela | -- | Lsi Lps | |
| Osmanovic Saban | $74,000 | -- |
Source: Public Records
Mortgage History
| Date | Status | Borrower | Loan Amount |
|---|---|---|---|
| Closed | Osmanovic Saban | $73,400 |
Source: Public Records
Tax History Compared to Growth
Tax History
| Year | Tax Paid | Tax Assessment Tax Assessment Total Assessment is a certain percentage of the fair market value that is determined by local assessors to be the total taxable value of land and additions on the property. | Land | Improvement |
|---|---|---|---|---|
| 2025 | $2,670 | $202,700 | $37,000 | $165,700 |
| 2024 | $2,670 | $191,000 | $30,000 | $161,000 |
| 2023 | $3,012 | $179,700 | $30,000 | $149,700 |
| 2022 | $2,816 | $141,300 | $25,000 | $116,300 |
| 2021 | $2,664 | $141,300 | $25,000 | $116,300 |
| 2020 | $2,257 | $118,100 | $25,000 | $93,100 |
| 2019 | $2,257 | $118,100 | $25,000 | $93,100 |
| 2018 | $2,027 | $105,600 | $25,000 | $80,600 |
| 2017 | $2,046 | $105,600 | $25,000 | $80,600 |
| 2016 | $1,974 | $101,400 | $25,000 | $76,400 |
| 2015 | $1,961 | $101,400 | $25,000 | $76,400 |
| 2014 | $1,844 | $94,800 | $25,000 | $69,800 |
| 2013 | -- | $94,800 | $25,000 | $69,800 |
Source: Public Records
Map
Nearby Homes