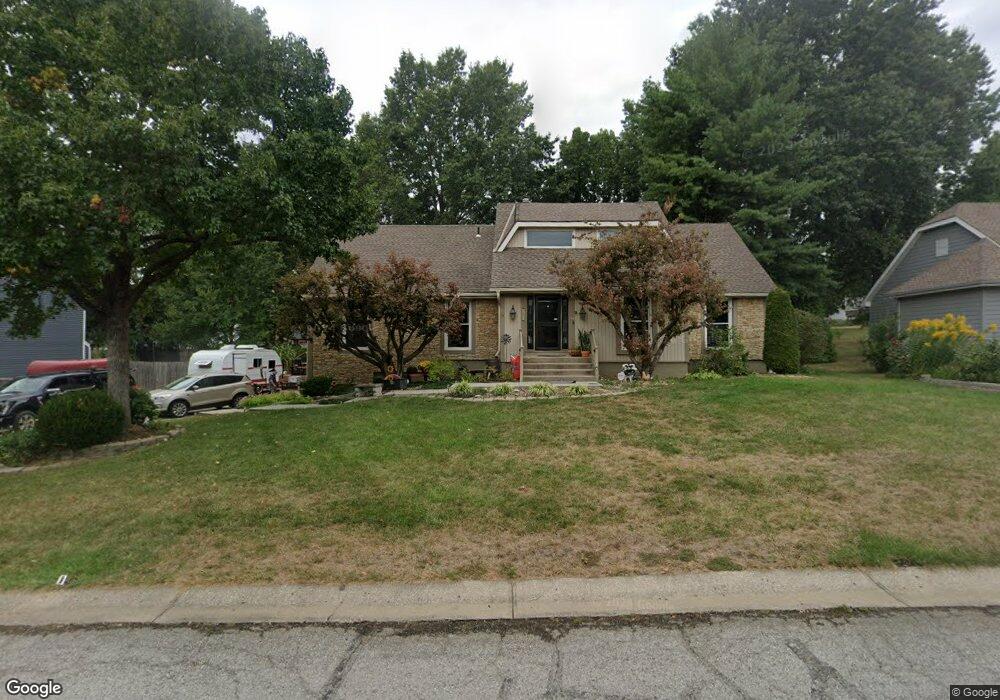
1601 NE Dana Dr Blue Springs, MO 64014
Estimated Value: $364,531 - $397,000
4
Beds
3
Baths
2,548
Sq Ft
$152/Sq Ft
Est. Value
About This Home
This home is located at 1601 NE Dana Dr, Blue Springs, MO 64014 and is currently estimated at $386,883, approximately $151 per square foot. 1601 NE Dana Dr is a home located in Jackson County with nearby schools including James Lewis Elementary School, Brittany Hill Middle School, and Blue Springs High School.
Ownership History
Date
Name
Owned For
Owner Type
Purchase Details
Closed on
Jul 25, 2022
Sold by
Beyer Michael C and Beyer Holly
Bought by
Michael And Holly Beyer Living Trust
Current Estimated Value
Purchase Details
Closed on
Sep 5, 2019
Sold by
Webb David W and Webb Linda K
Bought by
Beyer Michael C and Beyer Holly
Home Financials for this Owner
Home Financials are based on the most recent Mortgage that was taken out on this home.
Original Mortgage
$280,000
Interest Rate
3.7%
Mortgage Type
New Conventional
Purchase Details
Closed on
Sep 9, 2010
Sold by
Webb David W and Webb Linda K
Bought by
Brown Walley L and Brown Melinda R
Home Financials for this Owner
Home Financials are based on the most recent Mortgage that was taken out on this home.
Original Mortgage
$60,100
Interest Rate
7%
Mortgage Type
Seller Take Back
Create a Home Valuation Report for This Property
The Home Valuation Report is an in-depth analysis detailing your home's value as well as a comparison with similar homes in the area
Home Values in the Area
Average Home Value in this Area
Purchase History
| Date | Buyer | Sale Price | Title Company |
|---|---|---|---|
| Michael And Holly Beyer Living Trust | -- | None Listed On Document | |
| Beyer Michael C | -- | Kansas City Title Inc | |
| Brown Walley L | -- | None Available |
Source: Public Records
Mortgage History
| Date | Status | Borrower | Loan Amount |
|---|---|---|---|
| Previous Owner | Beyer Michael C | $280,000 | |
| Previous Owner | Brown Walley L | $60,100 |
Source: Public Records
Tax History Compared to Growth
Tax History
| Year | Tax Paid | Tax Assessment Tax Assessment Total Assessment is a certain percentage of the fair market value that is determined by local assessors to be the total taxable value of land and additions on the property. | Land | Improvement |
|---|---|---|---|---|
| 2025 | $4,451 | $62,744 | $11,341 | $51,403 |
| 2024 | $4,366 | $54,560 | $8,706 | $45,854 |
| 2023 | $4,366 | $54,561 | $5,535 | $49,026 |
| 2022 | $5,057 | $55,860 | $7,168 | $48,692 |
| 2021 | $5,053 | $55,860 | $7,168 | $48,692 |
| 2020 | $4,329 | $48,675 | $7,168 | $41,507 |
| 2019 | $4,185 | $48,675 | $7,168 | $41,507 |
| 2018 | $3,784 | $42,363 | $6,239 | $36,124 |
| 2017 | $3,705 | $42,363 | $6,239 | $36,124 |
| 2016 | $3,705 | $41,591 | $8,835 | $32,756 |
| 2014 | $3,767 | $42,151 | $8,252 | $33,899 |
Source: Public Records
Map
Nearby Homes
- 420 NE Golfview Dr
- 2012 NE Adams Dairy Rd
- 1001 NE Wien Ave
- 705 NE Locust Dr
- 1800 NE Waterfield Village Ct
- 311 NE Bridge Place
- 517 NE Johnston Dr
- 1136 NE 10th St
- 816 NE Mary Ct
- 404 NE Lee Dr
- 1200 NE Crestview Dr
- 204 NW Golfview Dr
- 1200 NE Hilltop Dr
- 458 NE Coronado Dr
- 1912 NW Manor Dr
- 280 NW Beau Dr
- 105 NE Leann Dr
- 1855 NE Duncan Rd
- 409 NW Locust Dr
- 0 NE Jefferson St
- 1605 NE Dana Dr
- 1511 NE Dana Dr
- 1604 NE Dana Dr
- 1600 NE Dana Dr
- 1609 NE Dana Dr
- 1608 NE Dana Dr
- 1507 NE Dana Dr
- 1512 NE Dana Dr
- 1312 NE Adams Dairy Rd
- 1612 NE Dana Dr
- 517 NE Tahoe Dr
- 600 NE Golfview Dr
- 513 NE Tahoe Dr
- 1508 NE Dana Dr
- 514 NE Golfview Dr
- 1616 NE Dana Dr
- 1808 NE Adams Dairy Rd
- 1900 NE Adams Dairy Rd
- 1904 NE Adams Dairy Rd
- 1908 NE Adams Dairy Rd