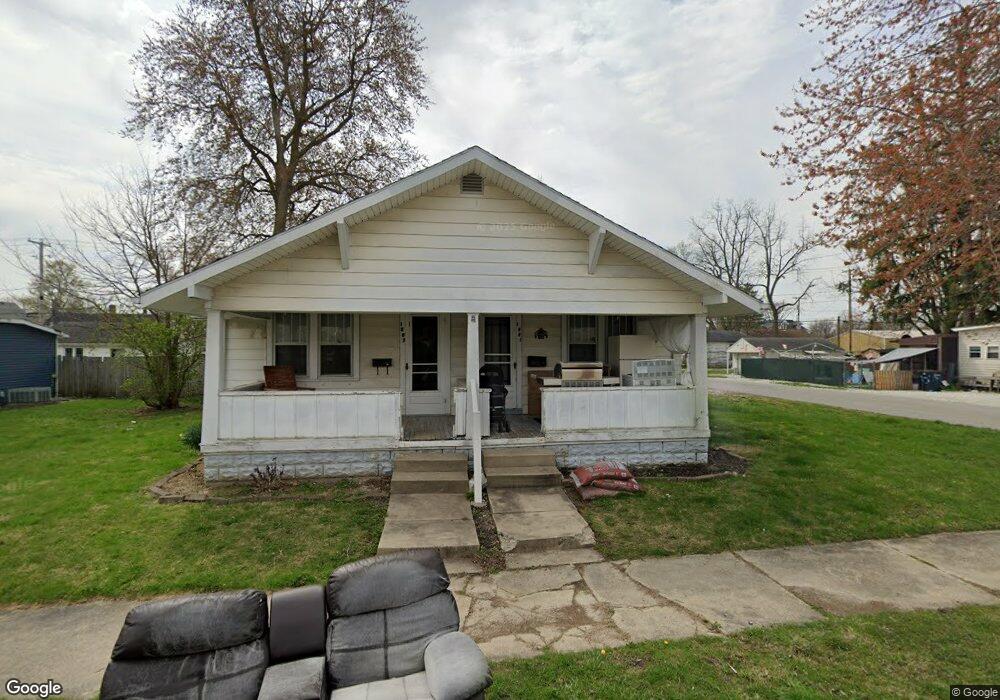
1601 S D St Elwood, IN 46036
Estimated Value: $78,000 - $190,264
2
Beds
2
Baths
1,632
Sq Ft
$75/Sq Ft
Est. Value
About This Home
This home is located at 1601 S D St, Elwood, IN 46036 and is currently estimated at $122,566, approximately $75 per square foot. 1601 S D St is a home located in Madison County with nearby schools including Elwood Elementary School, Elwood Intermediate School, and Elwood Junior-Senior High School.
Ownership History
Date
Name
Owned For
Owner Type
Purchase Details
Closed on
Apr 29, 2022
Sold by
Sides Stephen M
Bought by
Sides Enterprises Llc
Current Estimated Value
Purchase Details
Closed on
Mar 4, 2019
Sold by
Kothe Realty Enterprises Llc
Bought by
Sides Stephen M
Purchase Details
Closed on
Dec 15, 2016
Sold by
Kothe William H
Bought by
Kothe Realty Enterprises Llc
Purchase Details
Closed on
Aug 26, 2015
Sold by
Nichols Todd
Bought by
Kothe William H
Purchase Details
Closed on
Jul 21, 2008
Sold by
Federal National Mortgage Association
Bought by
Nichols Todd
Create a Home Valuation Report for This Property
The Home Valuation Report is an in-depth analysis detailing your home's value as well as a comparison with similar homes in the area
Home Values in the Area
Average Home Value in this Area
Purchase History
| Date | Buyer | Sale Price | Title Company |
|---|---|---|---|
| Sides Enterprises Llc | -- | None Listed On Document | |
| Sides Stephen M | -- | None Available | |
| Kothe Realty Enterprises Llc | -- | -- | |
| Kothe William H | -- | -- | |
| Nichols Todd | -- | -- |
Source: Public Records
Tax History Compared to Growth
Tax History
| Year | Tax Paid | Tax Assessment Tax Assessment Total Assessment is a certain percentage of the fair market value that is determined by local assessors to be the total taxable value of land and additions on the property. | Land | Improvement |
|---|---|---|---|---|
| 2024 | $1,286 | $64,300 | $10,500 | $53,800 |
| 2023 | $1,180 | $59,000 | $10,000 | $49,000 |
| 2022 | $1,176 | $58,300 | $9,300 | $49,000 |
| 2021 | $1,074 | $53,700 | $9,300 | $44,400 |
| 2020 | $1,032 | $51,100 | $8,800 | $42,300 |
| 2019 | $1,014 | $50,200 | $8,800 | $41,400 |
| 2018 | $998 | $49,400 | $8,800 | $40,600 |
| 2017 | $980 | $49,000 | $8,800 | $40,200 |
| 2016 | $990 | $49,600 | $8,800 | $40,800 |
| 2014 | $974 | $48,700 | $8,800 | $39,900 |
| 2013 | $974 | $48,700 | $8,800 | $39,900 |
Source: Public Records
Map
Nearby Homes