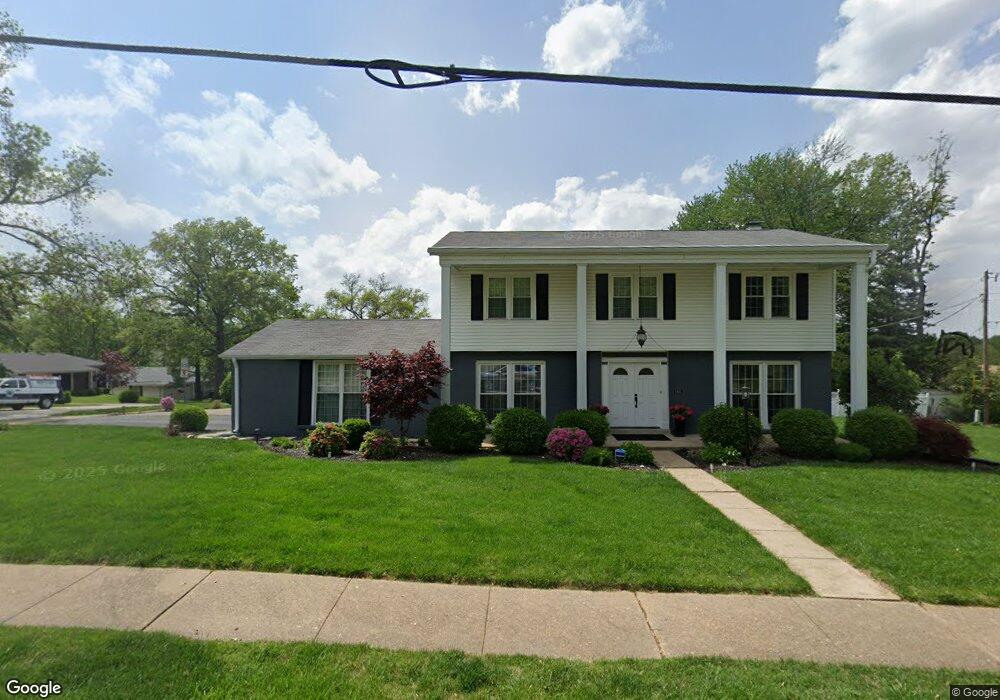
1601 Schulte Rd Saint Louis, MO 63146
Estimated Value: $356,000 - $401,000
4
Beds
3
Baths
2,004
Sq Ft
$192/Sq Ft
Est. Value
About This Home
This home is located at 1601 Schulte Rd, Saint Louis, MO 63146 and is currently estimated at $385,648, approximately $192 per square foot. 1601 Schulte Rd is a home located in St. Louis County with nearby schools including Craig Elementary School, Parkway Northeast Middle School, and Parkway North High School.
Ownership History
Date
Name
Owned For
Owner Type
Purchase Details
Closed on
Jun 11, 2009
Sold by
Lanzerotte Kim A and Rohe Kim A
Bought by
Lanzerotte Kim A
Current Estimated Value
Home Financials for this Owner
Home Financials are based on the most recent Mortgage that was taken out on this home.
Original Mortgage
$154,400
Outstanding Balance
$97,920
Interest Rate
4.84%
Mortgage Type
Stand Alone Refi Refinance Of Original Loan
Estimated Equity
$287,728
Purchase Details
Closed on
Jun 21, 2004
Sold by
Rohe Richard and Rohe Kim
Bought by
Rohe Kim
Purchase Details
Closed on
Aug 31, 2000
Sold by
Sarala Satyanarayana and Sarala Srinivasa
Bought by
Rohe Richard and Rohe Kim
Home Financials for this Owner
Home Financials are based on the most recent Mortgage that was taken out on this home.
Original Mortgage
$132,600
Interest Rate
8.15%
Create a Home Valuation Report for This Property
The Home Valuation Report is an in-depth analysis detailing your home's value as well as a comparison with similar homes in the area
Home Values in the Area
Average Home Value in this Area
Purchase History
| Date | Buyer | Sale Price | Title Company |
|---|---|---|---|
| Lanzerotte Kim A | -- | None Available | |
| Rohe Kim | -- | -- | |
| Rohe Richard | $156,000 | -- |
Source: Public Records
Mortgage History
| Date | Status | Borrower | Loan Amount |
|---|---|---|---|
| Open | Lanzerotte Kim A | $154,400 | |
| Closed | Rohe Richard | $132,600 | |
| Closed | Rohe Richard | $23,400 |
Source: Public Records
Tax History Compared to Growth
Tax History
| Year | Tax Paid | Tax Assessment Tax Assessment Total Assessment is a certain percentage of the fair market value that is determined by local assessors to be the total taxable value of land and additions on the property. | Land | Improvement |
|---|---|---|---|---|
| 2025 | $4,104 | $63,410 | $31,580 | $31,830 |
| 2024 | $4,104 | $62,740 | $21,050 | $41,690 |
| 2023 | $4,104 | $62,740 | $21,050 | $41,690 |
| 2022 | $3,614 | $50,990 | $21,050 | $29,940 |
| 2021 | $3,589 | $50,990 | $21,050 | $29,940 |
| 2020 | $3,624 | $49,190 | $23,620 | $25,570 |
| 2019 | $3,567 | $49,190 | $23,620 | $25,570 |
| 2018 | $3,184 | $40,490 | $17,330 | $23,160 |
| 2017 | $3,160 | $40,490 | $17,330 | $23,160 |
| 2016 | $3,060 | $37,280 | $12,180 | $25,100 |
| 2015 | $3,190 | $37,280 | $12,180 | $25,100 |
| 2014 | $2,708 | $33,770 | $8,250 | $25,520 |
Source: Public Records
Map
Nearby Homes
- 11655 Holly Springs Dr
- 11714 Casa Grande Dr
- 11741 Casa Grande Dr Unit G
- 11724 Russet Meadow Dr
- 11825 Villa Dorado Dr
- 1743 Russet Valley Dr
- 1747 Russet Valley Dr Unit 63
- 8 Montauk Ct
- 1407 Summerhaven Dr
- 11612 Misty Moss Ct
- 11875 Gold Leaf Dr
- 11515 Sandy View Dr
- 11921 Villa Dorado Dr Unit A
- 11983 Villa Dorado Dr Unit 211
- 1838 Moonstone Dr Unit 294
- 11861 Spruce Orchard Dr
- 1425 Craig Rd
- 11263 Pineside Dr
- 12045 Bridal Shire Ct
- 11993 Moorland Manor Ct
- 11709 Long Leaf Cir
- 1605 Schulte Rd
- 11717 Long Leaf Cir
- 11702 Long Leaf Cir
- 1 Decorah Dr
- 11710 Long Leaf Cir
- 1611 Schulte Rd
- 11723 Long Leaf Cir
- 2 Decorah Dr
- 11716 Long Leaf Cir
- 11720 Summerwood Dr
- 1550 Schulte Rd
- 11731 Long Leaf Cir
- 11722 Long Leaf Cir
- 83 Decorah Dr
- 11726 Summerwood Dr
- 11739 Long Leaf Cir
- 11730 Long Leaf Cir
- 53 Decorah Dr
- 11705 Summerwood Dr