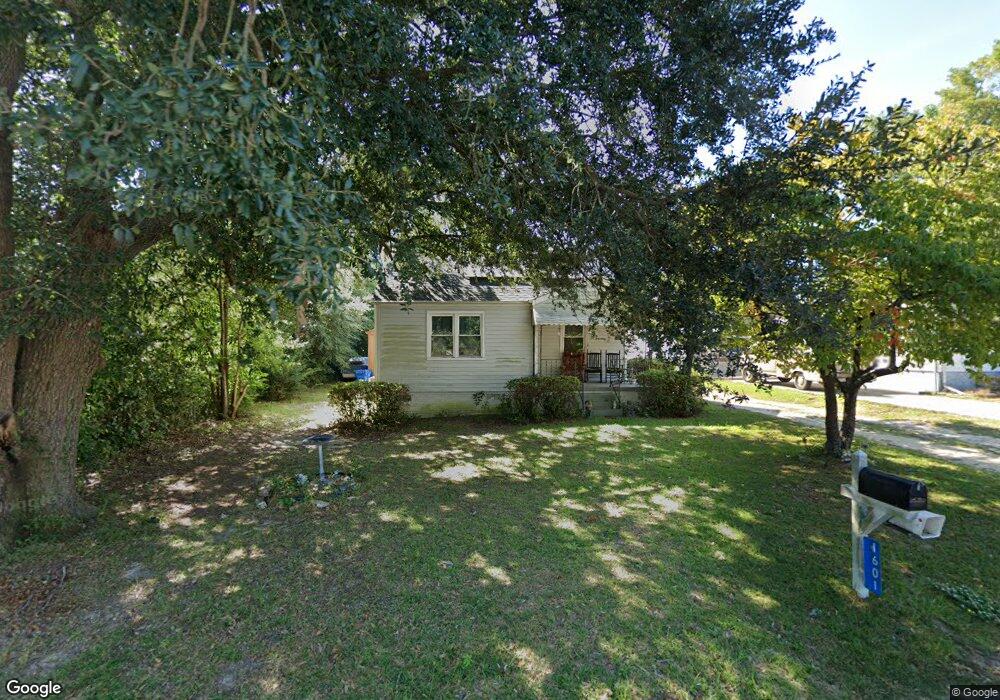
1601 Shull St West Columbia, SC 29169
Estimated Value: $119,000 - $156,000
2
Beds
1
Bath
832
Sq Ft
$164/Sq Ft
Est. Value
About This Home
This home is located at 1601 Shull St, West Columbia, SC 29169 and is currently estimated at $136,662, approximately $164 per square foot. 1601 Shull St is a home located in Lexington County with nearby schools including Riverbank Elementary, Cyril B. Busbee Creative Arts Academy, and Brookland-Cayce High School.
Ownership History
Date
Name
Owned For
Owner Type
Purchase Details
Closed on
Apr 24, 2018
Sold by
Whetstone Ceceil O and Whetstone Don W
Bought by
Wingard Marian A
Current Estimated Value
Home Financials for this Owner
Home Financials are based on the most recent Mortgage that was taken out on this home.
Original Mortgage
$61,250
Outstanding Balance
$36,002
Interest Rate
4.44%
Mortgage Type
New Conventional
Estimated Equity
$100,660
Purchase Details
Closed on
Nov 23, 2013
Sold by
Estate Of Norma Y Whetstone
Bought by
Whetstone Cecil O and Whetstone Don W
Create a Home Valuation Report for This Property
The Home Valuation Report is an in-depth analysis detailing your home's value as well as a comparison with similar homes in the area
Home Values in the Area
Average Home Value in this Area
Purchase History
| Date | Buyer | Sale Price | Title Company |
|---|---|---|---|
| Wingard Marian A | $65,000 | None Available | |
| Whetstone Cecil O | -- | -- |
Source: Public Records
Mortgage History
| Date | Status | Borrower | Loan Amount |
|---|---|---|---|
| Open | Wingard Marian A | $61,250 |
Source: Public Records
Tax History Compared to Growth
Tax History
| Year | Tax Paid | Tax Assessment Tax Assessment Total Assessment is a certain percentage of the fair market value that is determined by local assessors to be the total taxable value of land and additions on the property. | Land | Improvement |
|---|---|---|---|---|
| 2024 | $512 | $2,680 | $560 | $2,120 |
| 2023 | $512 | $2,680 | $560 | $2,120 |
| 2022 | $517 | $2,680 | $560 | $2,120 |
| 2020 | $497 | $2,680 | $560 | $2,120 |
| 2019 | $492 | $2,600 | $480 | $2,120 |
| 2018 | $302 | $1,582 | $480 | $1,102 |
| 2017 | $826 | $2,373 | $720 | $1,653 |
| 2016 | $836 | $2,372 | $720 | $1,652 |
| 2014 | $741 | $2,418 | $600 | $1,818 |
| 2013 | -- | $1,610 | $400 | $1,210 |
Source: Public Records
Map
Nearby Homes