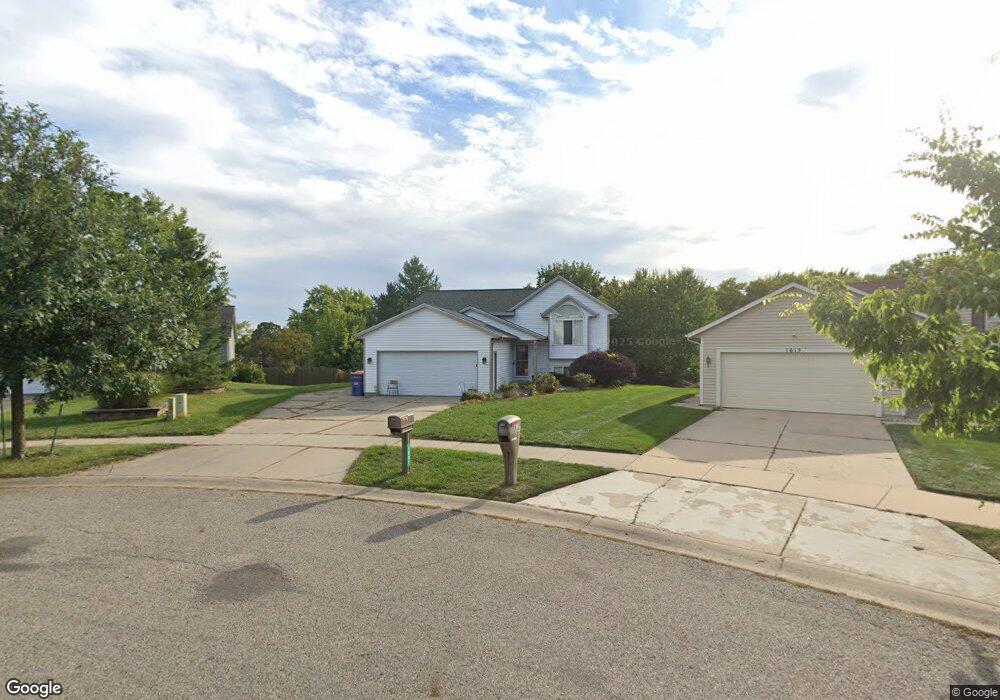
1601 Simmons Ave NE Grand Rapids, MI 49505
North East Citizens Action NeighborhoodEstimated Value: $403,258 - $431,000
3
Beds
2
Baths
1,228
Sq Ft
$338/Sq Ft
Est. Value
About This Home
This home is located at 1601 Simmons Ave NE, Grand Rapids, MI 49505 and is currently estimated at $414,815, approximately $337 per square foot. 1601 Simmons Ave NE is a home located in Kent County with nearby schools including Riverside Middle School, Union High School, and Lighthouse Academy - Waalkes Campus.
Ownership History
Date
Name
Owned For
Owner Type
Purchase Details
Closed on
Sep 28, 2006
Sold by
Kuiper Natasha and Cusack Natasha
Bought by
Ball Gary and Ball Doris
Current Estimated Value
Home Financials for this Owner
Home Financials are based on the most recent Mortgage that was taken out on this home.
Original Mortgage
$121,500
Outstanding Balance
$72,622
Interest Rate
6.49%
Mortgage Type
New Conventional
Estimated Equity
$342,193
Purchase Details
Closed on
Dec 12, 2003
Sold by
Schutt Mary Beth
Bought by
Kuiper Natasha
Home Financials for this Owner
Home Financials are based on the most recent Mortgage that was taken out on this home.
Original Mortgage
$119,200
Interest Rate
6.03%
Mortgage Type
Purchase Money Mortgage
Purchase Details
Closed on
Jan 29, 1999
Sold by
Deppe Hms and Deppe Schutt M
Bought by
Ball Schutt M and Ball Gary Doris
Purchase Details
Closed on
Dec 2, 1998
Sold by
Grnd Hghts and Grnd Schutt M
Bought by
Ball Schutt M and Ball Gary Doris
Create a Home Valuation Report for This Property
The Home Valuation Report is an in-depth analysis detailing your home's value as well as a comparison with similar homes in the area
Home Values in the Area
Average Home Value in this Area
Purchase History
| Date | Buyer | Sale Price | Title Company |
|---|---|---|---|
| Ball Gary | $161,500 | Chicago Title | |
| Kuiper Natasha | $149,000 | Metropolitan Title Co | |
| Ball Schutt M | $136,800 | -- | |
| Ball Schutt M | $25,500 | -- |
Source: Public Records
Mortgage History
| Date | Status | Borrower | Loan Amount |
|---|---|---|---|
| Open | Ball Gary | $121,500 | |
| Previous Owner | Kuiper Natasha | $119,200 |
Source: Public Records
Tax History Compared to Growth
Tax History
| Year | Tax Paid | Tax Assessment Tax Assessment Total Assessment is a certain percentage of the fair market value that is determined by local assessors to be the total taxable value of land and additions on the property. | Land | Improvement |
|---|---|---|---|---|
| 2025 | $3,020 | $194,100 | $0 | $0 |
| 2024 | $3,020 | $179,700 | $0 | $0 |
| 2023 | $3,064 | $155,000 | $0 | $0 |
| 2022 | $2,909 | $133,200 | $0 | $0 |
| 2021 | $2,844 | $125,000 | $0 | $0 |
| 2020 | $2,719 | $119,900 | $0 | $0 |
| 2019 | $2,848 | $107,000 | $0 | $0 |
| 2018 | $2,750 | $96,200 | $0 | $0 |
| 2017 | $2,677 | $89,900 | $0 | $0 |
| 2016 | $2,710 | $79,900 | $0 | $0 |
| 2015 | $2,520 | $79,900 | $0 | $0 |
| 2013 | -- | $76,600 | $0 | $0 |
Source: Public Records
Map
Nearby Homes
- 1444 Sweet St NE
- 1524 Sweet St NE
- 1518 Mayfield Ave NE
- 1452 Carlton Ave NE
- 1237 Dale Ct NE
- 1455 Ball Ave NE
- 1119 Kentwood Dr NE
- 1824 Herrick Ave NE
- 1119 Spencer St NE
- 1339 Fuller Ave NE
- 1250 Mayfield Ave NE
- 1238 Carlton Ave NE
- 1335 Knapp St NE
- 2027 Joan Ave NE
- 1332 Leonard St NE
- 2100 Dawson Ave NE
- 1228 Spring Ave NE
- 1256 Diamond Ave NE
- 1848 Emerald Ave NE
- 1060 Leonard St NE
- 1400 Manton St NE
- 1615 Simmons Ave NE
- 1403 Sweet St NE
- 1626 Carlton Ave NE
- 1640 Carlton Ave NE
- 1413 Sweet St NE
- 1410 Manton St NE
- 1623 Simmons Ave NE
- 1616 Carlton Ave NE
- 1648 Carlton Ave NE
- 1421 Sweet St NE
- 1606 Carlton Ave NE
- 1658 Carlton Ave NE
- 1624 Simmons Ave NE
- 1418 Manton St NE
- 1631 Simmons Ave NE
- 1427 Sweet St NE
- 1634 Simmons Ave NE
- 1428 Manton St NE
- 1410 Sweet St NE