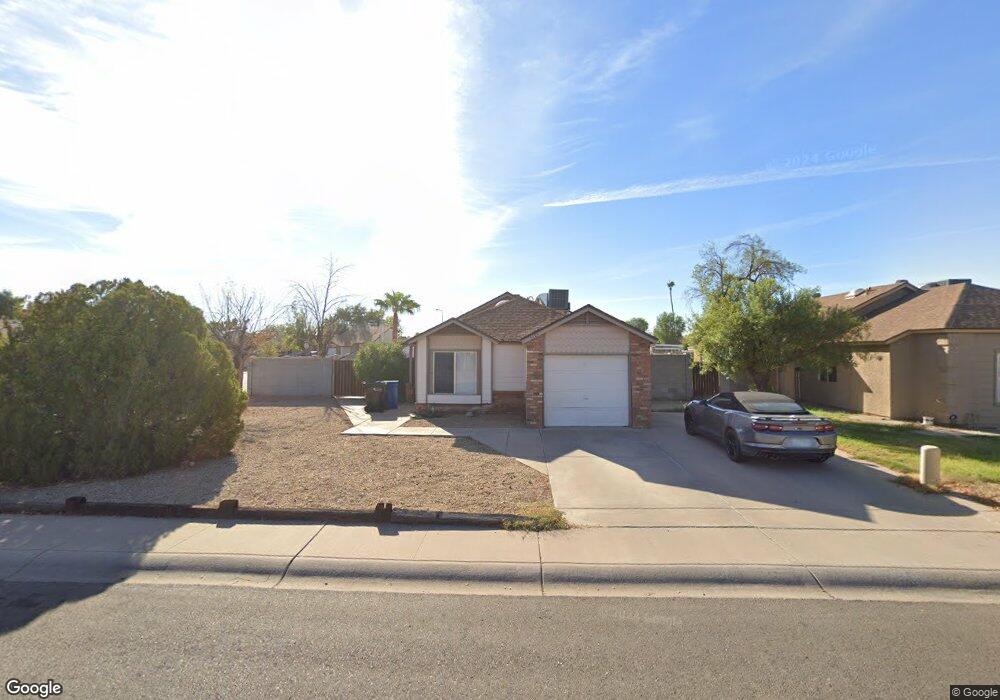
1601 W Straford Dr Unit 6 Chandler, AZ 85224
Amberwood NeighborhoodEstimated Value: $326,415 - $390,000
2
Beds
2
Baths
1,045
Sq Ft
$351/Sq Ft
Est. Value
About This Home
This home is located at 1601 W Straford Dr Unit 6, Chandler, AZ 85224 and is currently estimated at $366,854, approximately $351 per square foot. 1601 W Straford Dr Unit 6 is a home located in Maricopa County with nearby schools including Franklin at Brimhall Elementary School, Summit Academy Elementary, and Franklin Accelerated Academy Jordan Campus.
Ownership History
Date
Name
Owned For
Owner Type
Purchase Details
Closed on
Apr 18, 2003
Sold by
Murdock Ellen
Bought by
Stack Christopher M
Current Estimated Value
Home Financials for this Owner
Home Financials are based on the most recent Mortgage that was taken out on this home.
Original Mortgage
$94,400
Outstanding Balance
$43,955
Interest Rate
6.9%
Mortgage Type
New Conventional
Estimated Equity
$322,899
Purchase Details
Closed on
Mar 20, 1998
Sold by
Exley Lynda R
Bought by
Murdock Ellen
Home Financials for this Owner
Home Financials are based on the most recent Mortgage that was taken out on this home.
Original Mortgage
$83,936
Interest Rate
7.06%
Mortgage Type
FHA
Create a Home Valuation Report for This Property
The Home Valuation Report is an in-depth analysis detailing your home's value as well as a comparison with similar homes in the area
Home Values in the Area
Average Home Value in this Area
Purchase History
| Date | Buyer | Sale Price | Title Company |
|---|---|---|---|
| Stack Christopher M | $118,000 | Chicago Title Insurance Co | |
| Murdock Ellen | $84,000 | Nations Title Insurance |
Source: Public Records
Mortgage History
| Date | Status | Borrower | Loan Amount |
|---|---|---|---|
| Open | Stack Christopher M | $94,400 | |
| Previous Owner | Murdock Ellen | $83,936 |
Source: Public Records
Tax History Compared to Growth
Tax History
| Year | Tax Paid | Tax Assessment Tax Assessment Total Assessment is a certain percentage of the fair market value that is determined by local assessors to be the total taxable value of land and additions on the property. | Land | Improvement |
|---|---|---|---|---|
| 2025 | $1,064 | $12,474 | -- | -- |
| 2024 | $1,074 | $11,880 | -- | -- |
| 2023 | $1,074 | $27,650 | $5,530 | $22,120 |
| 2022 | $1,044 | $20,430 | $4,080 | $16,350 |
| 2021 | $1,050 | $18,870 | $3,770 | $15,100 |
| 2020 | $1,038 | $16,870 | $3,370 | $13,500 |
| 2019 | $956 | $15,420 | $3,080 | $12,340 |
| 2018 | $929 | $13,830 | $2,760 | $11,070 |
| 2017 | $893 | $12,620 | $2,520 | $10,100 |
| 2016 | $874 | $11,660 | $2,330 | $9,330 |
| 2015 | $822 | $10,450 | $2,090 | $8,360 |
Source: Public Records
Map
Nearby Homes
- 2014 W Summit Place
- 1853 W Plata Ave
- 1309 W Marlboro Dr
- 2937 S Pennington
- 2958 S El Paradiso
- 1805 W Cheyenne Dr
- 1126 W Elliot Rd Unit 1040
- 1126 W Elliot Rd Unit 1010
- 1203 W Alamo Dr
- 2030 W Portobello Ave
- 2615 N Yucca St
- 1910 W Onza Ave
- 1807 W Mission Dr
- 1337 W Pampa Ave
- 1821 W Mission Dr
- 1351 W Plata Ave
- 3030 S Alma School Rd Unit 12
- 3030 S Alma School Rd Unit 10
- 898 W Sterling Place
- 2334 W Peralta Ave
- 1603 W Straford Dr
- 3214 N Ash Dr
- 1591 W Straford Dr
- 1605 W Straford Dr
- 3210 N Ash Dr
- 3202 N Ash Cir
- 1600 W Straford Dr
- 1596 W Straford Dr
- 1587 W Straford Dr
- 1602 W Straford Dr
- 3206 N Ash Dr
- 1607 W Straford Dr
- 1592 W Straford Dr
- 1604 W Straford Dr
- 1606 W Curry Dr
- 3206 N Ash Cir
- 1588 W Straford Dr
- 1583 W Straford Dr
- 3202 N Ash Dr
- 1610 W Curry Dr