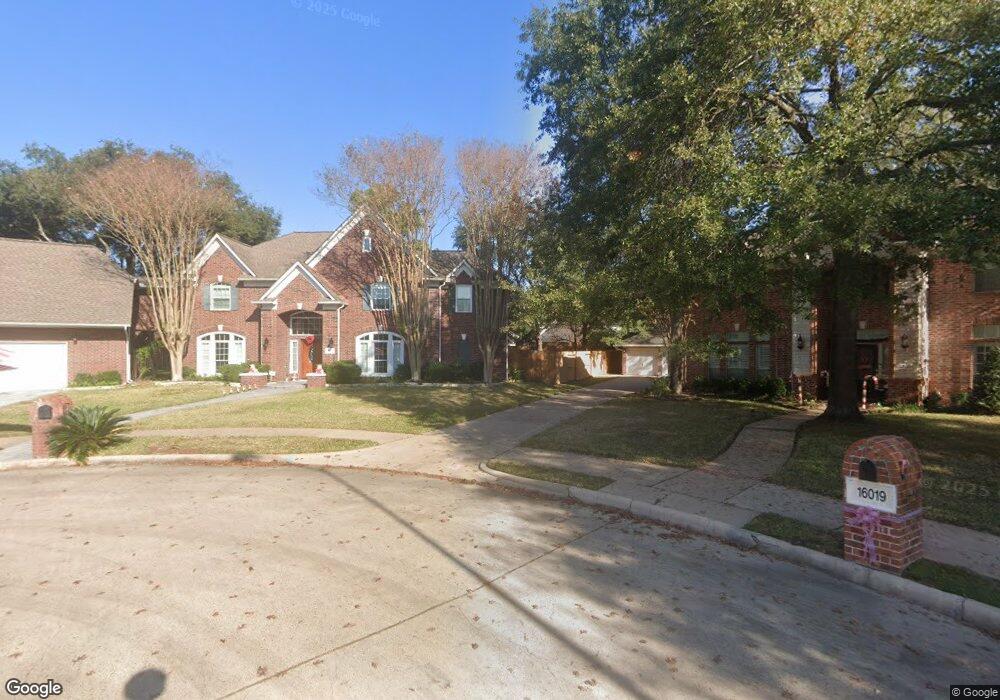
16015 Oak Island Dr Tomball, TX 77377
Estimated Value: $659,853 - $791,000
4
Beds
4
Baths
5,167
Sq Ft
$140/Sq Ft
Est. Value
About This Home
This home is located at 16015 Oak Island Dr, Tomball, TX 77377 and is currently estimated at $720,963, approximately $139 per square foot. 16015 Oak Island Dr is a home located in Harris County with nearby schools including Lakewood Elementary School, Willow Wood Junior High School, and Northpointe Intermediate School.
Ownership History
Date
Name
Owned For
Owner Type
Purchase Details
Closed on
Mar 30, 2016
Sold by
Pollock Keith
Bought by
Wozniak John A and Franey Brenda S
Current Estimated Value
Home Financials for this Owner
Home Financials are based on the most recent Mortgage that was taken out on this home.
Original Mortgage
$325,000
Outstanding Balance
$257,938
Interest Rate
3.65%
Mortgage Type
New Conventional
Estimated Equity
$463,025
Purchase Details
Closed on
Mar 8, 2000
Sold by
Pollock Martha Gomez
Bought by
Pollock Keith
Purchase Details
Closed on
Jun 30, 1997
Sold by
David Powers Homes W O Ltd
Bought by
Pollock Keith and Pollock Martha
Home Financials for this Owner
Home Financials are based on the most recent Mortgage that was taken out on this home.
Original Mortgage
$214,600
Interest Rate
7.92%
Create a Home Valuation Report for This Property
The Home Valuation Report is an in-depth analysis detailing your home's value as well as a comparison with similar homes in the area
Home Values in the Area
Average Home Value in this Area
Purchase History
| Date | Buyer | Sale Price | Title Company |
|---|---|---|---|
| Wozniak John A | -- | Old Republic National Title | |
| Pollock Keith | -- | -- | |
| Pollock Keith | -- | Stewart Title |
Source: Public Records
Mortgage History
| Date | Status | Borrower | Loan Amount |
|---|---|---|---|
| Open | Wozniak John A | $325,000 | |
| Previous Owner | Pollock Keith | $214,600 | |
| Closed | Pollock Keith | $76,700 | |
| Closed | Pollock Keith | $0 |
Source: Public Records
Tax History Compared to Growth
Tax History
| Year | Tax Paid | Tax Assessment Tax Assessment Total Assessment is a certain percentage of the fair market value that is determined by local assessors to be the total taxable value of land and additions on the property. | Land | Improvement |
|---|---|---|---|---|
| 2025 | $5,395 | $614,090 | $81,602 | $532,488 |
| 2024 | $5,395 | $619,867 | $78,305 | $541,562 |
| 2023 | $5,395 | $647,099 | $70,474 | $576,625 |
| 2022 | $11,493 | $556,434 | $70,474 | $485,960 |
| 2021 | $11,022 | $441,872 | $49,456 | $392,416 |
| 2020 | $10,753 | $415,314 | $49,456 | $365,858 |
| 2019 | $10,233 | $384,832 | $47,395 | $337,437 |
| 2018 | $4,397 | $385,159 | $43,913 | $341,246 |
| 2017 | $10,224 | $385,159 | $43,913 | $341,246 |
| 2016 | $10,224 | $385,159 | $43,913 | $341,246 |
| 2015 | $7,952 | $385,159 | $43,913 | $341,246 |
| 2014 | $7,952 | $332,291 | $43,913 | $288,378 |
Source: Public Records
Map
Nearby Homes
- 11611 Teal Hollow Ln
- 15915 Broad Oak Ct
- 11831 Gray Forest Trail
- 16206 Lakewood Field Dr
- 11814 Lake Grove Ct
- 11722 Gray Forest Trail
- 16102 Buckhead Ct
- 11719 Lakewood Crossing Dr
- 15726 Gettysburg Dr
- 11802 Laurel Meadow Dr
- 15903 Heron Trail
- 16855 E Maglitto Cir
- 15627 Gettysburg Dr
- 11650 Brentcross Dr
- 11619 Buck Springs Trail
- 16218 Jordyn Lake Dr
- 16106 Limestone Lake Dr
- 15703 Downford Dr
- 11607 Buck Springs Trail
- 11606 Gatesden Dr
- 11519 Pecan Canyon Ct
- 16019 Oak Island Dr
- 11515 Pecan Canyon Ct
- 16007 Oak Island Dr
- 16018 Oak Island Dr
- 16014 Oak Island Dr
- 16207 Hidden Grove Trail
- 16010 Oak Island Dr
- 16202 Lakewood Grove Dr
- 16006 Oak Island Dr
- 16210 Hidden Grove Trail
- 16206 Lakewood Grove Dr
- 16211 Hidden Grove Trail
- 16002 Oak Island Dr
- 11503 Pecan Canyon Ct
- 11510 Pecan Canyon Ct
- 11607 Teal Hollow Ln
- 16210 Lakewood Grove Dr
- 11515 Hidden Grove Ct
- 11502 Pecan Canyon Ct