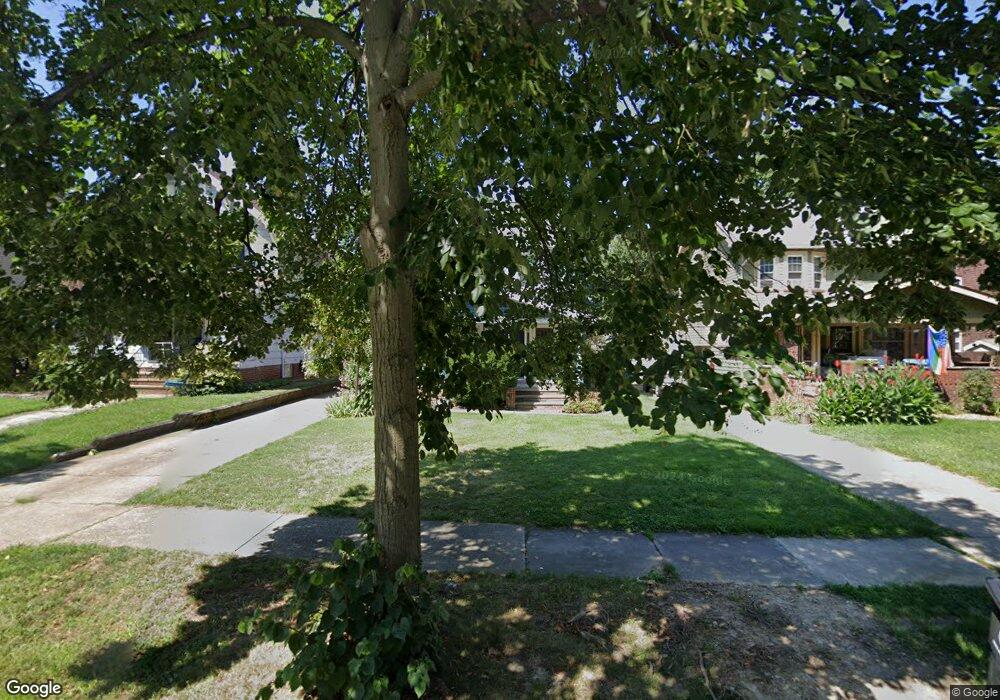
1602 Belle Ave Lakewood, OH 44107
Estimated Value: $320,000 - $396,000
3
Beds
1
Bath
1,616
Sq Ft
$223/Sq Ft
Est. Value
About This Home
This home is located at 1602 Belle Ave, Lakewood, OH 44107 and is currently estimated at $361,036, approximately $223 per square foot. 1602 Belle Ave is a home located in Cuyahoga County with nearby schools including Grant Elementary School, Garfield Middle School, and Lakewood High School.
Ownership History
Date
Name
Owned For
Owner Type
Purchase Details
Closed on
Sep 21, 2000
Sold by
Delmonico Michael A
Bought by
Shelt Derek W and Shelt Wendy M
Current Estimated Value
Home Financials for this Owner
Home Financials are based on the most recent Mortgage that was taken out on this home.
Original Mortgage
$136,000
Outstanding Balance
$49,392
Interest Rate
8.05%
Estimated Equity
$311,644
Purchase Details
Closed on
May 20, 1994
Sold by
Rawlings Matthew E
Bought by
Delmonico Michael A
Purchase Details
Closed on
Jul 29, 1988
Sold by
Bernacki Robert Martin
Bought by
Rawlings Matthew E
Purchase Details
Closed on
Apr 21, 1982
Sold by
Bernacki Robert M and Bernacki Joyce
Bought by
Bernacki Robert Martin
Purchase Details
Closed on
Nov 25, 1975
Sold by
Kintner Chas D and Kintner Flossie M
Bought by
Bernacki Robert M and Bernacki Joyce
Purchase Details
Closed on
Jan 1, 1975
Bought by
Kintner Chas D and Kintner Flossie M
Create a Home Valuation Report for This Property
The Home Valuation Report is an in-depth analysis detailing your home's value as well as a comparison with similar homes in the area
Home Values in the Area
Average Home Value in this Area
Purchase History
| Date | Buyer | Sale Price | Title Company |
|---|---|---|---|
| Shelt Derek W | $146,000 | -- | |
| Delmonico Michael A | $125,000 | -- | |
| Rawlings Matthew E | $94,900 | -- | |
| Bernacki Robert Martin | -- | -- | |
| Bernacki Robert M | $25,000 | -- | |
| Kintner Chas D | -- | -- |
Source: Public Records
Mortgage History
| Date | Status | Borrower | Loan Amount |
|---|---|---|---|
| Open | Shelt Derek W | $136,000 |
Source: Public Records
Tax History Compared to Growth
Tax History
| Year | Tax Paid | Tax Assessment Tax Assessment Total Assessment is a certain percentage of the fair market value that is determined by local assessors to be the total taxable value of land and additions on the property. | Land | Improvement |
|---|---|---|---|---|
| 2024 | $6,847 | $106,610 | $23,590 | $83,020 |
| 2023 | $6,150 | $81,940 | $19,920 | $62,020 |
| 2022 | $6,189 | $81,940 | $19,920 | $62,020 |
| 2021 | $6,126 | $81,940 | $19,920 | $62,020 |
| 2020 | $5,434 | $63,530 | $15,440 | $48,090 |
| 2019 | $5,326 | $181,500 | $44,100 | $137,400 |
| 2018 | $5,105 | $63,530 | $15,440 | $48,090 |
| 2017 | $4,925 | $53,450 | $11,800 | $41,650 |
| 2016 | $4,891 | $53,450 | $11,800 | $41,650 |
| 2015 | $4,893 | $53,450 | $11,800 | $41,650 |
| 2014 | $4,893 | $51,380 | $11,340 | $40,040 |
Source: Public Records
Map
Nearby Homes
- 1593 Marlowe Ave
- 1545 Marlowe Ave
- 1675 Roosevelt Ave
- 1480 Warren Rd Unit 313
- 1480 Warren Rd
- 1594 Victoria Ave
- 1669 Robinwood Ave
- 1415 Olivewood Ave Unit 17
- 1578 Mars Ave
- 2078 Baxterly Ave
- 1532 Parkwood Rd
- 1576 Wyandotte Ave
- 14404 Bayes Ave
- 15555 Hilliard Rd Unit 401A
- 1337 Cook Ave
- 1550 Lakeland Ave
- 1590 Lakeland Ave
- 1458 Wyandotte Ave
- 14924 Arden Ave
- 1463 Wyandotte Ave
- 1608 Belle Ave
- 1598 Belle Ave
- 1612 Belle Ave
- 1592 Belle Ave
- 1597 Saint Charles Ave
- 1616 Belle Ave
- 1588 Belle Ave
- 1605 Saint Charles Ave
- 1591 Saint Charles Ave
- 1609 Saint Charles Ave
- 1620 Belle Ave
- 1584 Belle Ave
- 1585 Saint Charles Ave
- 1615 Saint Charles Ave
- 1624 Belle Ave
- 1580 Belle Ave
- 1603 Belle Ave
- 1607 Belle Ave
- 1581 Saint Charles Ave
- 1599 Belle Ave