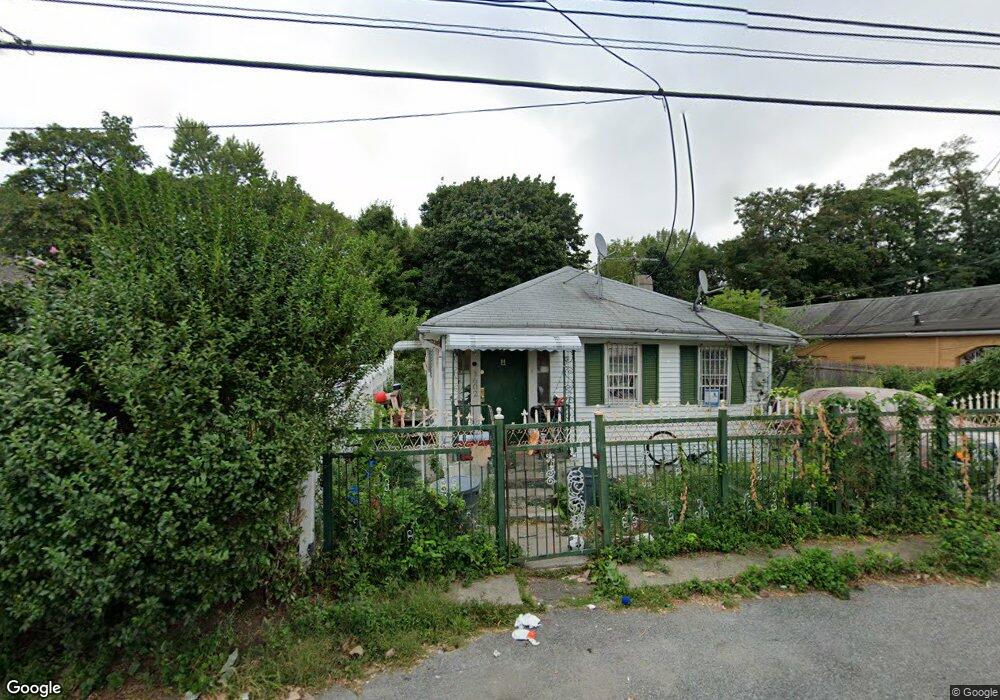
1602 Harding Park Bronx, NY 10473
Clason Point NeighborhoodEstimated Value: $440,000 - $614,000
Studio
--
Bath
1,150
Sq Ft
$450/Sq Ft
Est. Value
About This Home
This home is located at 1602 Harding Park, Bronx, NY 10473 and is currently estimated at $517,764, approximately $450 per square foot. 1602 Harding Park is a home located in Bronx County with nearby schools including P.S. 069 Journey Prep School - X069 and Holy Cross Elementary School.
Ownership History
Date
Name
Owned For
Owner Type
Purchase Details
Closed on
Oct 10, 2023
Sold by
Big Ants Inc
Bought by
Dingra Inc
Current Estimated Value
Purchase Details
Closed on
Sep 27, 2010
Sold by
Rohoman Nirmala
Bought by
Big Ants Inc
Purchase Details
Closed on
Jul 20, 2006
Sold by
Big Ants Inc and Rohoman
Bought by
Rohoman Nirmala
Purchase Details
Closed on
Jan 12, 2002
Sold by
Rohoman Nirmala
Bought by
Big Ants Inc and Rohoman
Purchase Details
Closed on
Nov 14, 2000
Sold by
Big Ants Inc
Bought by
Rohoman Nirmala
Purchase Details
Closed on
Feb 10, 1998
Sold by
Hanif Shamerna
Bought by
Big Ants Inc
Purchase Details
Closed on
Aug 1, 1996
Sold by
Oci Mtg Corp
Bought by
Hanif Shamerna
Create a Home Valuation Report for This Property
The Home Valuation Report is an in-depth analysis detailing your home's value as well as a comparison with similar homes in the area
Home Values in the Area
Average Home Value in this Area
Purchase History
We collect this data history from publicly available records. To have your information removed, we recommend requesting removal directly through your county’s website.
| Date | Buyer | Sale Price | Title Company |
|---|---|---|---|
| Dingra Inc | -- | -- | |
| Dingra Inc | -- | -- | |
| Big Ants Inc | -- | -- | |
| Big Ants Inc | -- | -- | |
| Rohoman Nirmala | -- | -- | |
| Rohoman Nirmala | -- | -- | |
| Big Ants Inc | -- | -- | |
| Big Ants Inc | -- | -- | |
| Rohoman Nirmala | -- | The Title Guarantee Company | |
| Rohoman Nirmala | -- | The Title Guarantee Company | |
| Big Ants Inc | -- | Commonwealth Land Title Ins | |
| Big Ants Inc | -- | Commonwealth Land Title Ins | |
| Hanif Shamerna | $55,000 | Ticor Title Guarantee Compan | |
| Hanif Shamerna | $55,000 | Ticor Title Guarantee Compan |
Source: Public Records
Tax History
| Year | Tax Paid | Tax Assessment Tax Assessment Total Assessment is a certain percentage of the fair market value that is determined by local assessors to be the total taxable value of land and additions on the property. | Land | Improvement |
|---|---|---|---|---|
| 2026 | $3,281 | $16,336 | $4,196 | $12,140 |
| 2025 | $3,245 | $16,336 | $4,996 | $11,340 |
| 2024 | $3,245 | $16,157 | $4,857 | $11,300 |
| 2023 | $3,099 | $15,260 | $4,729 | $10,531 |
| 2022 | $2,875 | $28,740 | $8,460 | $20,280 |
| 2021 | $2,865 | $25,260 | $8,460 | $16,800 |
| 2020 | $2,881 | $26,880 | $8,460 | $18,420 |
| 2019 | $2,817 | $26,400 | $8,460 | $17,940 |
| 2018 | $2,592 | $12,717 | $3,906 | $8,811 |
| 2017 | $2,446 | $12,000 | $5,206 | $6,794 |
| 2016 | $2,268 | $11,344 | $6,637 | $4,707 |
| 2015 | $1,146 | $11,344 | $6,957 | $4,387 |
| 2014 | $1,146 | $11,220 | $5,852 | $5,368 |
Source: Public Records
Map
Nearby Homes
- 203 White Plains Rd
- 1323 Harding Park
- 1329 Harding Park
- 246 Soundview Ave
- 252 Soundview Ave
- 325 Underhill Ave
- 324 Underhill Ave
- 326 Underhill Ave
- 320 Thieriot Ave
- 227 Stephens Ave
- 332 Underhill Ave
- 1015 Harding Park
- 334 Underhill Ave
- 321 Newman Ave
- 306 Newman Ave
- 126 Mermaid Ln Unit 174
- 356 Underhill Ave
- 122 Stephens Ave
- 230 Fleet Ct Unit 16230
- 121 Sunset Blvd Unit 10121
- 1611 Harding Park
- 1612 Harding Park
- 1610 Harding Park
- 1613 Harding Park
- 1614 Harding Park
- 1608 Harding Park
- 1615 Harding Park
- 1615 Harding Park Camp
- 201 Bolton Ave
- 1606 Harding Park
- 1512 Harding Park
- 1616 Harding Park
- 1509 Harding Park
- 1509 Harding Park Ave
- 1508 Harding Park
- 1617 Harding Park
- 1513 Harding Park
- 1515 Harding Park
- 1514 Harding Park
- 1507 Harding Park
Your Personal Tour Guide
Ask me questions while you tour the home.