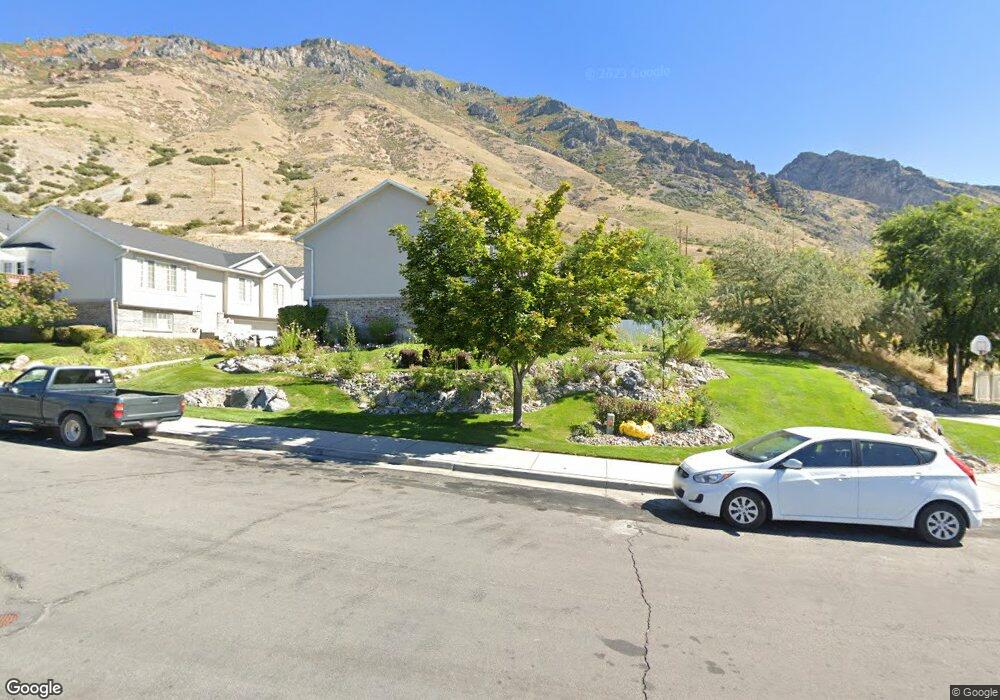
1602 N 100 E Springville, UT 84663
Little Rock Canyon NeighborhoodEstimated Value: $412,000 - $439,000
4
Beds
2
Baths
1,800
Sq Ft
$234/Sq Ft
Est. Value
About This Home
This home is located at 1602 N 100 E, Springville, UT 84663 and is currently estimated at $421,230, approximately $234 per square foot. 1602 N 100 E is a home located in Utah County with nearby schools including Cherry Creek Elementary School, Springville Junior High School, and Springville High School.
Ownership History
Date
Name
Owned For
Owner Type
Purchase Details
Closed on
Jun 14, 2018
Sold by
Leman Peter D and Leman Christi
Bought by
Nielsen Ryan and Nielsen Holly
Current Estimated Value
Home Financials for this Owner
Home Financials are based on the most recent Mortgage that was taken out on this home.
Original Mortgage
$226,100
Outstanding Balance
$195,539
Interest Rate
4.5%
Mortgage Type
New Conventional
Estimated Equity
$225,691
Purchase Details
Closed on
Aug 5, 2011
Sold by
Leman Peter D
Bought by
Leman Peter D and Leman Christi
Home Financials for this Owner
Home Financials are based on the most recent Mortgage that was taken out on this home.
Original Mortgage
$127,600
Interest Rate
4.46%
Mortgage Type
New Conventional
Purchase Details
Closed on
Dec 3, 2004
Sold by
Earth & Image Lc
Bought by
Clegg Randy B and Clegg Janalyn
Create a Home Valuation Report for This Property
The Home Valuation Report is an in-depth analysis detailing your home's value as well as a comparison with similar homes in the area
Home Values in the Area
Average Home Value in this Area
Purchase History
| Date | Buyer | Sale Price | Title Company |
|---|---|---|---|
| Nielsen Ryan | -- | Stewart Title Ins Agcy Of Ut | |
| Leman Peter D | -- | Title West Orem | |
| Leman Peter D | -- | First American Orem | |
| Clegg Randy B | -- | Title West Title Company |
Source: Public Records
Mortgage History
| Date | Status | Borrower | Loan Amount |
|---|---|---|---|
| Open | Nielsen Ryan | $226,100 | |
| Previous Owner | Leman Peter D | $127,600 |
Source: Public Records
Tax History
| Year | Tax Paid | Tax Assessment Tax Assessment Total Assessment is a certain percentage of the fair market value that is determined by local assessors to be the total taxable value of land and additions on the property. | Land | Improvement |
|---|---|---|---|---|
| 2025 | $2,090 | $214,335 | -- | -- |
| 2024 | $2,090 | $214,115 | $0 | $0 |
| 2023 | $2,025 | $207,625 | $0 | $0 |
| 2022 | $2,104 | $211,915 | $0 | $0 |
| 2021 | $1,898 | $297,500 | $50,000 | $247,500 |
| 2020 | $1,717 | $261,000 | $50,000 | $211,000 |
| 2019 | $1,571 | $243,000 | $50,000 | $193,000 |
| 2018 | $1,547 | $228,300 | $50,000 | $178,300 |
| 2017 | $1,566 | $122,815 | $0 | $0 |
| 2016 | $1,359 | $104,500 | $0 | $0 |
| 2015 | $1,190 | $93,500 | $0 | $0 |
| 2014 | $1,162 | $90,750 | $0 | $0 |
Source: Public Records
Map
Nearby Homes
Your Personal Tour Guide
Ask me questions while you tour the home.