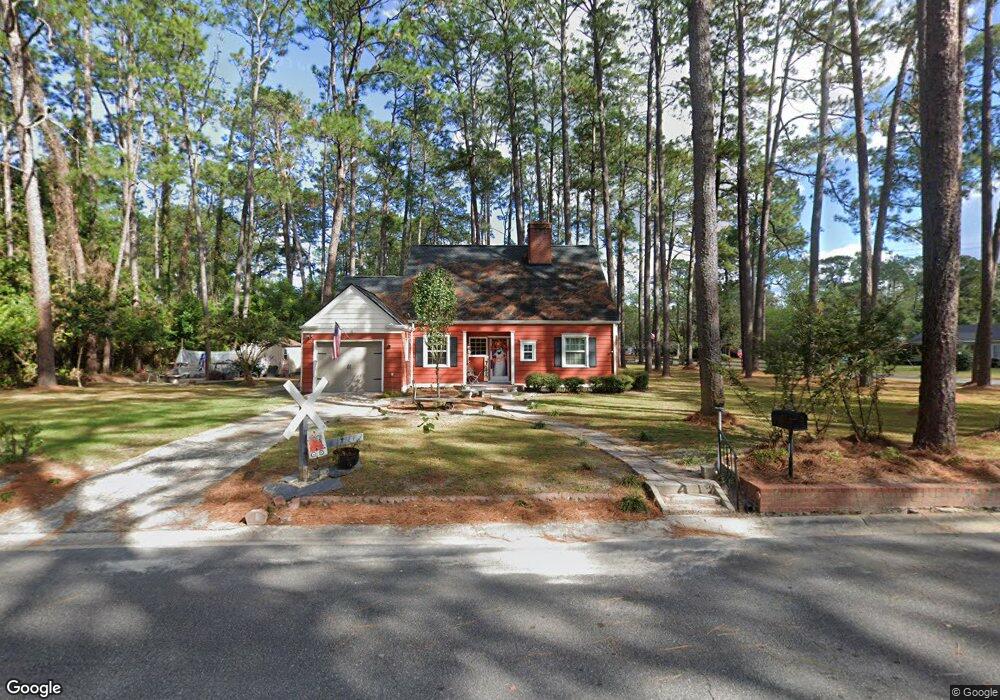
1602 Oconee Rd Waycross, GA 31501
Estimated Value: $193,724 - $255,000
3
Beds
2
Baths
1,860
Sq Ft
$116/Sq Ft
Est. Value
About This Home
This home is located at 1602 Oconee Rd, Waycross, GA 31501 and is currently estimated at $215,431, approximately $115 per square foot. 1602 Oconee Rd is a home located in Ware County with nearby schools including Center Elementary School, Waycross Middle School, and Ware County High School.
Ownership History
Date
Name
Owned For
Owner Type
Purchase Details
Closed on
Jun 4, 2020
Sold by
Childers Lisa M
Bought by
Anderson Vickie Diane
Current Estimated Value
Home Financials for this Owner
Home Financials are based on the most recent Mortgage that was taken out on this home.
Original Mortgage
$143,434
Outstanding Balance
$127,380
Interest Rate
3.3%
Mortgage Type
New Conventional
Estimated Equity
$88,051
Purchase Details
Closed on
Mar 9, 2018
Sold by
Lasseter Valerie
Bought by
Childers Lisa M
Home Financials for this Owner
Home Financials are based on the most recent Mortgage that was taken out on this home.
Original Mortgage
$116,844
Interest Rate
5.5%
Mortgage Type
FHA
Purchase Details
Closed on
Aug 8, 2011
Sold by
Federal National Mortgage Association
Bought by
Hurtado Valerie
Purchase Details
Closed on
Jul 6, 2010
Sold by
Bac Home Loans Servicing Lp
Bought by
Federal National Mortgage Association
Create a Home Valuation Report for This Property
The Home Valuation Report is an in-depth analysis detailing your home's value as well as a comparison with similar homes in the area
Home Values in the Area
Average Home Value in this Area
Purchase History
| Date | Buyer | Sale Price | Title Company |
|---|---|---|---|
| Anderson Vickie Diane | $142,000 | -- | |
| Childers Lisa M | $119,000 | -- | |
| Hurtado Valerie | $72,975 | -- | |
| Federal National Mortgage Association | $140,678 | -- | |
| Bac Home Loans Servicing Lp | $140,678 | -- |
Source: Public Records
Mortgage History
| Date | Status | Borrower | Loan Amount |
|---|---|---|---|
| Open | Anderson Vickie Diane | $143,434 | |
| Previous Owner | Childers Lisa M | $116,844 |
Source: Public Records
Tax History Compared to Growth
Tax History
| Year | Tax Paid | Tax Assessment Tax Assessment Total Assessment is a certain percentage of the fair market value that is determined by local assessors to be the total taxable value of land and additions on the property. | Land | Improvement |
|---|---|---|---|---|
| 2024 | $1,822 | $67,349 | $12,060 | $55,289 |
| 2023 | $1,860 | $59,039 | $6,824 | $52,215 |
| 2022 | $2,353 | $59,039 | $6,824 | $52,215 |
| 2021 | $2,020 | $46,716 | $6,824 | $39,892 |
| 2020 | $1,984 | $45,525 | $6,824 | $38,701 |
| 2019 | $1,618 | $36,609 | $6,824 | $29,785 |
| 2018 | $1,517 | $35,450 | $6,856 | $28,594 |
| 2017 | $1,480 | $35,450 | $6,856 | $28,594 |
| 2016 | $1,480 | $35,450 | $6,856 | $28,594 |
| 2015 | $1,491 | $35,449 | $6,856 | $28,594 |
| 2014 | $1,489 | $35,450 | $6,856 | $28,594 |
| 2013 | -- | $35,449 | $6,856 | $28,593 |
Source: Public Records
Map
Nearby Homes
- 706 Cherokee Cir
- 1002 Cherokee Cir
- 1500 Saint Marys Dr
- 1001 Coral Rd
- 1011 Cherokee Cir
- 1701 Satilla Blvd
- 907 Euclid Ave
- 707 Euclid Ave
- 1103 Kontz Ave
- 0 Saint Marys Dr Unit (TRACT 2 0.25 ACRES)
- 1715 City Blvd
- 1009 Euclid Ave
- Lot 3 City Blvd
- 1100 Euclid Ave
- 00 Seminole Trail
- 1009 Baltimore Ave
- 2108 Screven Ave
- 1205 Dean Dr
- 1002 Baltimore Ave
- 1400 E Cherokee Dr
- 1605 Suwanne Dr
- 1601 Oconee Rd
- 1603 Oconee Rd
- 808 Seminole Trail
- 1511 Suwanne Dr
- 1609 Suwanne Dr
- 1599 Oconee Rd
- 1600 St Mary's Dr
- 1600 Saint Marys Dr
- 1602 Saint Marys Dr
- 901 Seminole Trail
- 1602 Suwanne Dr
- 808 Cherokee Cir
- 804 Cherokee Cir
- 1520 Saint Marys Dr
- 900 Seminole Trail
- 1606 Suwanne Dr
- 1606 Suwanne Dr
- 1580 Oconee Rd
- 800 Cherokee Cir