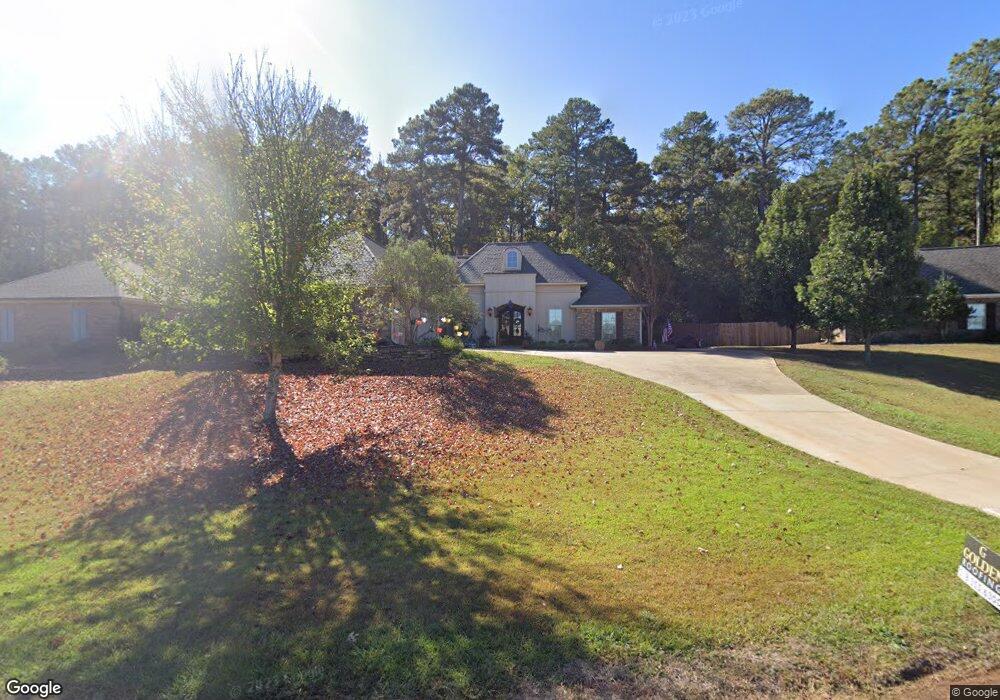
1602 Rampart Dr Ruston, LA 71270
Estimated Value: $356,000 - $393,065
4
Beds
3
Baths
2,154
Sq Ft
$171/Sq Ft
Est. Value
About This Home
This home is located at 1602 Rampart Dr, Ruston, LA 71270 and is currently estimated at $367,266, approximately $170 per square foot. 1602 Rampart Dr is a home located in Lincoln Parish with nearby schools including Hillcrest Elementary School, Ruston Elementary School, and Ruston Junior High School.
Ownership History
Date
Name
Owned For
Owner Type
Purchase Details
Closed on
Jul 8, 2015
Sold by
Patterson Robert Jarod and Patterson Heather Rhea
Bought by
Williams Kenneth David and Williams Kathy B
Current Estimated Value
Home Financials for this Owner
Home Financials are based on the most recent Mortgage that was taken out on this home.
Original Mortgage
$253,650
Outstanding Balance
$195,906
Interest Rate
3.91%
Mortgage Type
New Conventional
Estimated Equity
$171,360
Purchase Details
Closed on
Oct 11, 2007
Sold by
Alsup Jacob Daniel
Bought by
Patterson Robert Jarod and Patterson Heather Rhea Harrel
Home Financials for this Owner
Home Financials are based on the most recent Mortgage that was taken out on this home.
Original Mortgage
$32,740
Interest Rate
6.48%
Mortgage Type
Purchase Money Mortgage
Create a Home Valuation Report for This Property
The Home Valuation Report is an in-depth analysis detailing your home's value as well as a comparison with similar homes in the area
Purchase History
| Date | Buyer | Sale Price | Title Company |
|---|---|---|---|
| Williams Kenneth David | $285,000 | None Available | |
| Patterson Robert Jarod | $35,500 | None Available |
Source: Public Records
Mortgage History
| Date | Status | Borrower | Loan Amount |
|---|---|---|---|
| Open | Williams Kenneth David | $253,650 | |
| Previous Owner | Patterson Robert Jarod | $32,740 |
Source: Public Records
Tax History
| Year | Tax Paid | Tax Assessment Tax Assessment Total Assessment is a certain percentage of the fair market value that is determined by local assessors to be the total taxable value of land and additions on the property. | Land | Improvement |
|---|---|---|---|---|
| 2025 | $2,913 | $34,130 | $5,115 | $29,015 |
| 2024 | $2,913 | $34,129 | $5,115 | $29,014 |
| 2023 | $2,614 | $29,410 | $3,627 | $25,783 |
| 2022 | $2,627 | $29,410 | $3,627 | $25,783 |
| 2021 | $2,432 | $29,411 | $3,627 | $25,784 |
| 2020 | $2,321 | $27,923 | $3,627 | $24,296 |
| 2019 | $2,356 | $29,015 | $3,627 | $25,388 |
| 2018 | $2,292 | $29,015 | $3,627 | $25,388 |
| 2017 | $2,298 | $29,015 | $3,627 | $25,388 |
| 2016 | $2,289 | $0 | $0 | $0 |
| 2015 | $2,216 | $25,799 | $3,645 | $22,154 |
| 2013 | $2,251 | $25,799 | $3,645 | $22,154 |
Source: Public Records
Map
Nearby Homes
- 1709 Rampart Dr
- 2900 Post Oak Dr
- 2805 Post Oak Dr
- 0 English Turn
- 2605 Foxxwood Dr
- 1001 Chase Ln
- 2420 Highway 33
- 905 Tarreyton Dr
- 0 Louisiana 33
- 503 Dayton Dr
- 3001 Belcara Dr
- 503 E Kentucky Ave
- 2408 Rhody Dr
- 910 Laura Ln
- 402 E Kentucky Ave
- 1727 Trade Dr
- 128 Marlou Cir
- 294 Moody Rd
- 200 Pinecrest Dr
- 521 Audubon Dr
- 1606 Rampart Dr
- Lot #96 Rampart Dr
- Lot #98 Rampart Dr
- 1600 Rampart Dr
- 3001 Bourbon St
- 1603 Rampart Dr
- 1608 Rampart Dr
- 1607 Rampart Dr
- 3003 Bourbon St
- 1609 Rampart Dr
- 1700 Rampart Dr
- 3005 Bourbon St
- 1602 Esplanade Ave
- 1606 Esplanade Ave
- 1613 Rampart Dr
- 1608 Esplanade Ave
- 3009 Bourbon St
- 1704 Rampart Dr
- 1703 Rampart Dr
- 1612 Esplanade Ave
Your Personal Tour Guide
Ask me questions while you tour the home.