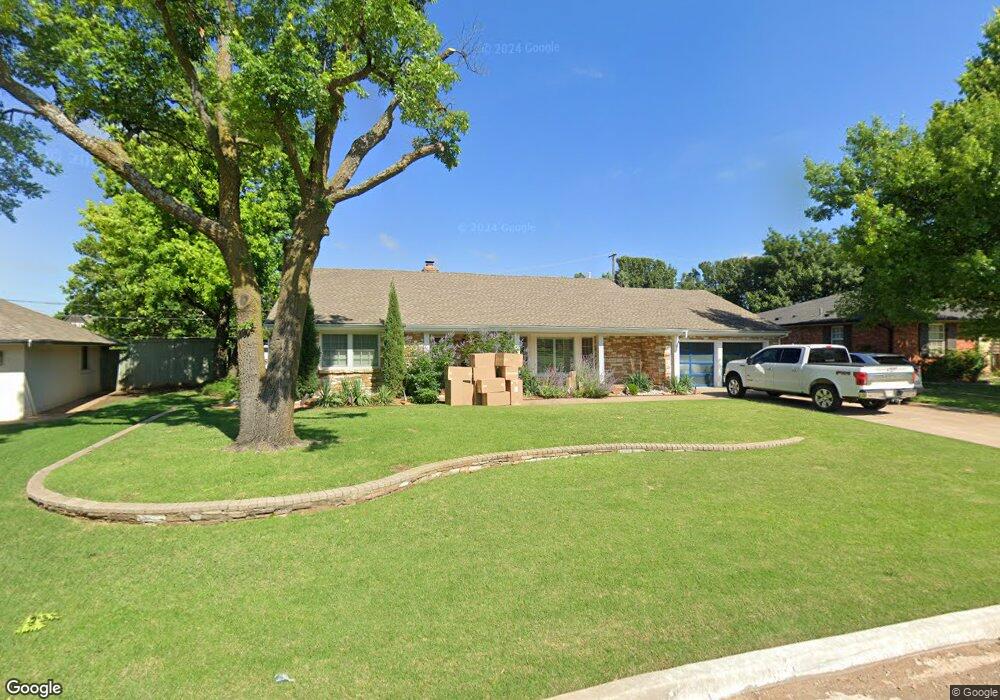
1602 Randel Rd Nichols Hills, OK 73116
Estimated Value: $641,000 - $849,428
2
Beds
2
Baths
2,298
Sq Ft
$334/Sq Ft
Est. Value
About This Home
This home is located at 1602 Randel Rd, Nichols Hills, OK 73116 and is currently estimated at $766,857, approximately $333 per square foot. 1602 Randel Rd is a home located in Oklahoma County with nearby schools including Nichols Hills Elementary School, John Marshall Middle School, and John Marshall High School.
Ownership History
Date
Name
Owned For
Owner Type
Purchase Details
Closed on
Aug 8, 2012
Sold by
Stockbridge Garry Lee and Stockbridge Reba Michelle
Bought by
Stockbridge Garry L and Stockbridge Reba Michelle
Current Estimated Value
Purchase Details
Closed on
Nov 14, 2006
Sold by
Walker Ronald E and Fields Timothy Mark
Bought by
Stockbridge Garry Lee and Stockbridge Reba Michelle
Home Financials for this Owner
Home Financials are based on the most recent Mortgage that was taken out on this home.
Original Mortgage
$296,000
Outstanding Balance
$176,657
Interest Rate
6.37%
Mortgage Type
Purchase Money Mortgage
Estimated Equity
$590,200
Purchase Details
Closed on
Oct 31, 2002
Sold by
Will Cynthia A
Bought by
Walker Ronald E and Fields Timothy Mark
Create a Home Valuation Report for This Property
The Home Valuation Report is an in-depth analysis detailing your home's value as well as a comparison with similar homes in the area
Home Values in the Area
Average Home Value in this Area
Purchase History
| Date | Buyer | Sale Price | Title Company |
|---|---|---|---|
| Stockbridge Garry L | -- | None Available | |
| Stockbridge Garry Lee | $370,000 | Trustmark Title | |
| Walker Ronald E | $215,000 | Capitol Abstract & Title Co |
Source: Public Records
Mortgage History
| Date | Status | Borrower | Loan Amount |
|---|---|---|---|
| Open | Stockbridge Garry Lee | $296,000 |
Source: Public Records
Tax History Compared to Growth
Tax History
| Year | Tax Paid | Tax Assessment Tax Assessment Total Assessment is a certain percentage of the fair market value that is determined by local assessors to be the total taxable value of land and additions on the property. | Land | Improvement |
|---|---|---|---|---|
| 2024 | $10,875 | $81,868 | $13,277 | $68,591 |
| 2023 | $10,875 | $78,842 | $11,351 | $67,491 |
| 2022 | $8,992 | $70,512 | $11,516 | $58,996 |
| 2021 | $8,631 | $67,155 | $11,632 | $55,523 |
| 2020 | $8,549 | $64,295 | $11,632 | $52,663 |
| 2019 | $8,217 | $62,400 | $10,248 | $52,152 |
| 2018 | $7,586 | $59,429 | $0 | $0 |
| 2017 | $7,083 | $56,598 | $9,936 | $46,662 |
| 2016 | $6,887 | $53,903 | $9,856 | $44,047 |
| 2015 | $6,533 | $51,336 | $9,855 | $41,481 |
| 2014 | $6,095 | $48,892 | $10,340 | $38,552 |
Source: Public Records
Map
Nearby Homes
- 6208 Waterford Blvd Unit 95
- 6208 Waterford Blvd Unit 112
- 1708 Randel Rd
- 6206 Waterford Blvd Unit 78Y
- 1422 Glenbrook Terrace
- 1725 Huntington Ave
- 1409 Glenbrook Terrace
- 2105 NW 59th Place
- 6400 Briarwood Ln
- 1707 Pennington Way
- 1301 NW 63rd St
- 2017 Huntington Ave
- 6216 Harden Dr
- 6409 N Hillcrest Ave
- 6000 N Pennsylvania Ave Unit 115
- 6000 N Pennsylvania Ave Unit 46
- 6000 N Pennsylvania Ave Unit 59 (214A)
- 6000 N Pennsylvania Ave Unit 62 (215A)
- 2017 NW 56th Terrace
- 1201 Glenbrook Terrace
- 1604 Randel Rd
- 1600 Randel Rd
- 1601 Randel Rd
- 1606 Randel Rd
- 1609 Glenbrook Terrace
- 1608 Glenbrook Terrace
- 1608 Randel Rd
- 1609 Randel Rd
- 1606 Glenbrook Terrace
- 1607 Glenbrook Terrace
- 1610 Randel Rd
- 1611 Randel Rd
- 1604 Glenbrook Terrace
- 1605 Glenbrook Terrace
- 1612 Randel Rd
- 1615 Randel Rd
- 1602 Glenbrook Terrace
- 1603 Glenbrook Terrace
- 1614 Randel Rd