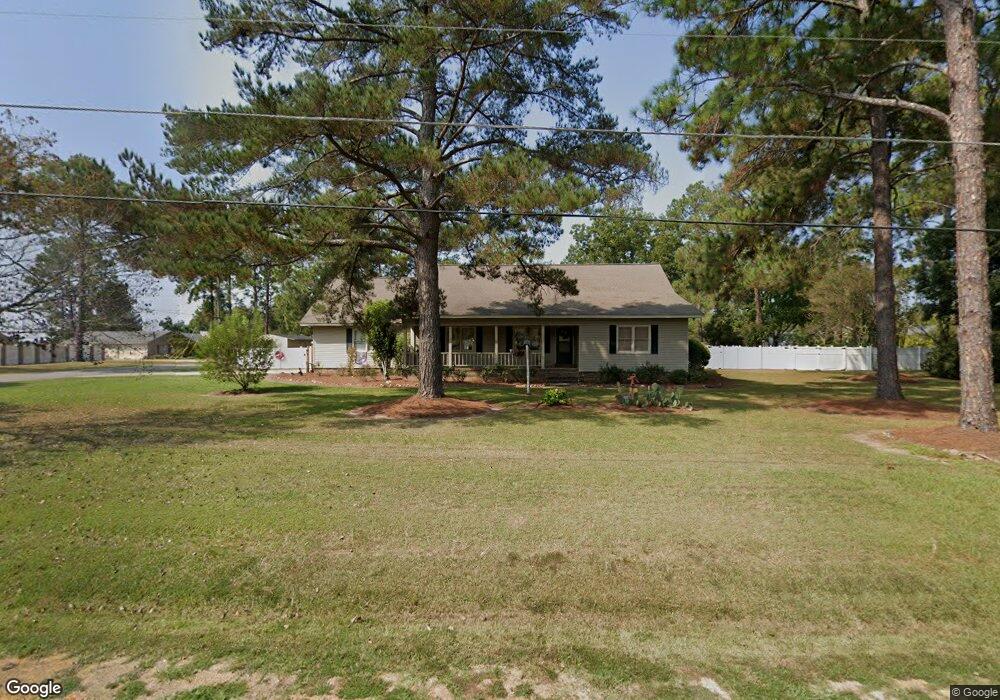
1602 Rutland Rd Tifton, GA 31793
Estimated Value: $327,000 - $452,000
4
Beds
3
Baths
3,238
Sq Ft
$114/Sq Ft
Est. Value
About This Home
This home is located at 1602 Rutland Rd, Tifton, GA 31793 and is currently estimated at $369,458, approximately $114 per square foot. 1602 Rutland Rd is a home located in Tift County with nearby schools including Annie Belle Clark Primary School, Matt Wilson Elementary School, and J.T. Reddick School.
Ownership History
Date
Name
Owned For
Owner Type
Purchase Details
Closed on
Apr 29, 2022
Sold by
Groves Kenneth J
Bought by
Groves Kenneth J and Groves Kayla Renee
Current Estimated Value
Home Financials for this Owner
Home Financials are based on the most recent Mortgage that was taken out on this home.
Original Mortgage
$216,000
Outstanding Balance
$203,047
Interest Rate
4.16%
Mortgage Type
New Conventional
Estimated Equity
$166,411
Purchase Details
Closed on
Oct 5, 2012
Sold by
Barton Gwen C
Bought by
Taylor Charles R and Taylor Sandra J
Purchase Details
Closed on
Jul 28, 2006
Sold by
Inglett Richard F
Bought by
Barton Marvin C and Barton Gwen C
Purchase Details
Closed on
Aug 31, 1999
Sold by
L'Herault Mark F
Bought by
Inglett Richard F
Purchase Details
Closed on
Jun 22, 1995
Bought by
L'Herault Mark F
Purchase Details
Closed on
Jul 13, 1990
Bought by
Huntington Dewitt H
Purchase Details
Closed on
Oct 31, 1989
Bought by
Buffaloe James J and Buffaloe Patri
Create a Home Valuation Report for This Property
The Home Valuation Report is an in-depth analysis detailing your home's value as well as a comparison with similar homes in the area
Home Values in the Area
Average Home Value in this Area
Purchase History
| Date | Buyer | Sale Price | Title Company |
|---|---|---|---|
| Groves Kenneth J | -- | -- | |
| Taylor Charles R | $197,500 | -- | |
| Barton Marvin C | $197,000 | -- | |
| Inglett Richard F | $162,500 | -- | |
| L'Herault Mark F | $122,000 | -- | |
| Huntington Dewitt H | $118,000 | -- | |
| Buffaloe James J | $93,200 | -- |
Source: Public Records
Mortgage History
| Date | Status | Borrower | Loan Amount |
|---|---|---|---|
| Open | Groves Kenneth J | $216,000 |
Source: Public Records
Tax History Compared to Growth
Tax History
| Year | Tax Paid | Tax Assessment Tax Assessment Total Assessment is a certain percentage of the fair market value that is determined by local assessors to be the total taxable value of land and additions on the property. | Land | Improvement |
|---|---|---|---|---|
| 2024 | $2,990 | $137,032 | $11,600 | $125,432 |
| 2023 | $2,761 | $95,875 | $6,800 | $89,075 |
| 2022 | $2,846 | $95,875 | $6,800 | $89,075 |
| 2021 | $2,862 | $95,875 | $6,800 | $89,075 |
| 2020 | $2,393 | $78,646 | $6,800 | $71,846 |
| 2019 | $2,388 | $78,646 | $6,800 | $71,846 |
| 2018 | $2,385 | $78,646 | $6,800 | $71,846 |
| 2017 | $2,396 | $78,646 | $6,800 | $71,846 |
| 2016 | $2,398 | $78,646 | $6,800 | $71,846 |
| 2015 | $2,399 | $78,646 | $6,800 | $71,846 |
| 2014 | $2,404 | $78,646 | $6,800 | $71,846 |
| 2013 | -- | $77,937 | $6,800 | $71,137 |
Source: Public Records
Map
Nearby Homes
- 1808 Rutland Rd
- 2008 Rutland Rd Unit 10
- 2008 Rutland Rd
- 100 Elizabeth Dr
- 26 Alan Ln
- Tract 1 Whiddon Mill Rd
- 131 Oak Point Ave
- 31 Henry Way
- 7 Deborah Dr
- 106 Mill Ridge Cir
- 0 W Hutchinson Rd
- 21 Willow Way
- W Hutchinson Rd
- 1901 Melba Dr
- 51 Logan Dr
- 9 Country Club Place
- 1610 Mallard Ln
- 1607 Mallard Ln
- 11 Fairway Dr
- 0 S Carpenter Rd
- 1606 Rutland Rd
- 4003 Frazier Cir
- 1412 Rutland Rd
- 4006 Sandy Cir
- 1601 Rutland Rd
- 1610 Rutland Rd
- 4006 Frazier Cir
- 1413 Rutland Rd
- 1605 Rutland Rd
- 1605 Rutland Rd
- 4009 Frazier Cir
- 1410 Rutland Rd
- 0 Sandy Cir
- 4008 Frazier Cir
- 4007 Sandy Cir
- 1411 Rutland Rd
- 4005 Sandy Cir
- 4010 Frazier Cir
- 4009 Sandy Cir
- 1609 Rutland Rd