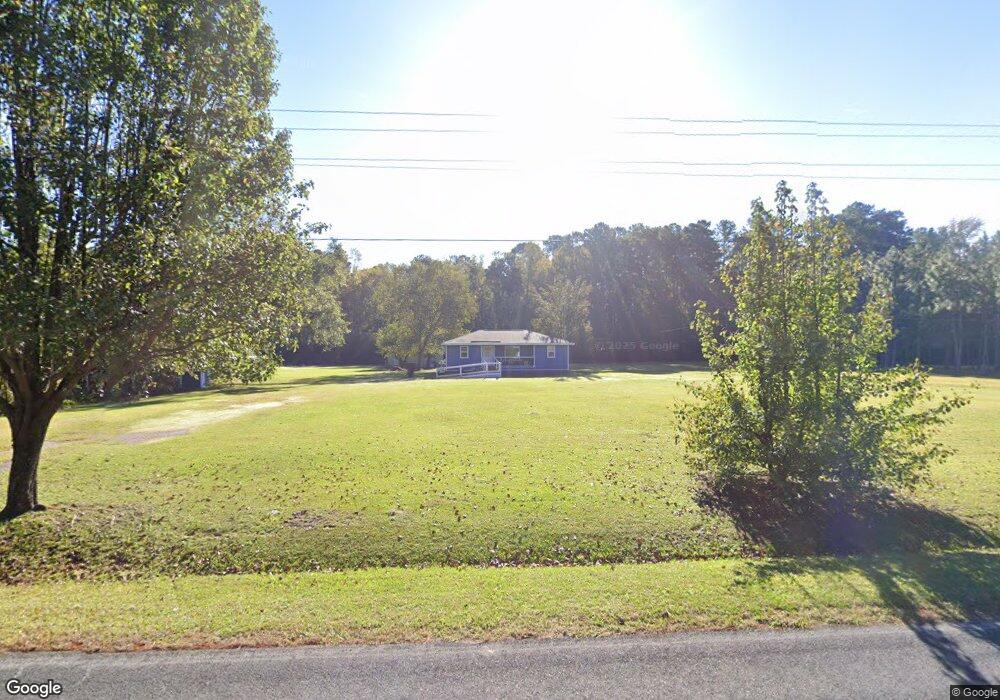
1602 Saint Mark Bowman Rd Saint George, SC 29477
Estimated Value: $204,000 - $270,000
--
Bed
--
Bath
1,024
Sq Ft
$232/Sq Ft
Est. Value
About This Home
This home is located at 1602 Saint Mark Bowman Rd, Saint George, SC 29477 and is currently estimated at $237,737, approximately $232 per square foot. 1602 Saint Mark Bowman Rd is a home located in Dorchester County with nearby schools including Williams Memorial Elementary School, St. George Middle School, and Harleyville-Ridgeville Middle.
Ownership History
Date
Name
Owned For
Owner Type
Purchase Details
Closed on
Jan 9, 2008
Sold by
Metts Betty Jo and Metts Michael R
Bought by
Moore Robert S and Moore Carol T
Current Estimated Value
Home Financials for this Owner
Home Financials are based on the most recent Mortgage that was taken out on this home.
Original Mortgage
$38,250
Interest Rate
6.05%
Mortgage Type
Unknown
Purchase Details
Closed on
Nov 20, 2007
Sold by
Deutsche Bank National Trust Co
Bought by
Metts Betty Jo and Metts Michael R
Home Financials for this Owner
Home Financials are based on the most recent Mortgage that was taken out on this home.
Original Mortgage
$38,250
Interest Rate
6.05%
Mortgage Type
Unknown
Purchase Details
Closed on
Nov 20, 2006
Sold by
Risher Kevin B
Bought by
Deutsche Bank National Trust Co and New Century Home Equity Loan Trust Serie
Purchase Details
Closed on
Nov 26, 2003
Sold by
Metts Michael R and Metts Betty Jo K
Bought by
Risher Kevin B
Create a Home Valuation Report for This Property
The Home Valuation Report is an in-depth analysis detailing your home's value as well as a comparison with similar homes in the area
Home Values in the Area
Average Home Value in this Area
Purchase History
| Date | Buyer | Sale Price | Title Company |
|---|---|---|---|
| Moore Robert S | $45,000 | Attorney | |
| Metts Betty Jo | $44,500 | Attorney | |
| Deutsche Bank National Trust Co | $500 | None Available | |
| Risher Kevin B | $67,500 | -- |
Source: Public Records
Mortgage History
| Date | Status | Borrower | Loan Amount |
|---|---|---|---|
| Closed | Moore Robert S | $38,250 |
Source: Public Records
Tax History Compared to Growth
Tax History
| Year | Tax Paid | Tax Assessment Tax Assessment Total Assessment is a certain percentage of the fair market value that is determined by local assessors to be the total taxable value of land and additions on the property. | Land | Improvement |
|---|---|---|---|---|
| 2025 | $145 | $8,565 | $1,400 | $7,165 |
| 2024 | $145 | $8,565 | $1,400 | $7,165 |
| 2023 | $0 | $3,068 | $400 | $2,668 |
| 2022 | $145 | $3,860 | $400 | $3,460 |
| 2021 | $740 | $3,860 | $400 | $3,460 |
| 2020 | $107 | $3,860 | $400 | $3,460 |
| 2019 | $603 | $3,860 | $400 | $3,460 |
| 2018 | $603 | $3,860 | $400 | $3,460 |
| 2017 | $599 | $3,860 | $400 | $3,460 |
| 2016 | $589 | $3,860 | $400 | $3,460 |
| 2015 | $587 | $3,860 | $400 | $3,460 |
| 2014 | $569 | $96,600 | $0 | $0 |
| 2013 | -- | $3,860 | $0 | $0 |
Source: Public Records
Map
Nearby Homes
- 461 Reeves Farm Rd
- 471 Reeves Farm Rd
- 472 Reeves Farm Rd
- 00 Mulberry Rd
- 9493 Charleston Hwy
- 9501 Charleston Hwy
- 0 Misty Glen Rd
- 9619 Charleston Hwy
- 226 Smith Ln
- 678 Winningham Rd
- 686 Winningham Rd
- 0 Ordie Rd Unit 22026751
- 338 Westbury Rd
- 0-D Shady Grove Rd
- 0 Foliage St
- 0 Mulberry Rd Unit 22536201
- 0 Mulberry Rd Unit 25022166
- 335 Hudson Rd
- 00 Davis Terrace
- 01 Davis Terrace
- 1603 Saint Mark Bowman Rd
- 1613 Saint Mark Bowman Rd
- 1621 Saint Mark Bowman Rd
- 1578 Saint Mark Bowman Rd
- 1589 Saint Mark Bowman Rd
- 1639 Saint Mark Bowman Rd
- 1639 St Mark Bowman Rd
- 1562 Saint Mark Bowman Rd
- 1648 Saint Mark Bowman Rd
- 1561 Saint Mark Bowman Rd
- 1657 Saint Mark Bowman Rd
- 1668 Saint Mark Bowman Rd
- 1314 Mount Zion Rd
- 1308 Mount Zion Rd
- 1315 Mount Zion Rd
- 1506 Saint Mark Bowman Rd
- 0 Lemon Grove Rd Unit 2211415
- 0 Lemon Grove Rd Unit 2323664
- 0 Lemon Grove Rd Unit 2522952
- 0 Lemon Grove Rd Unit 2701875