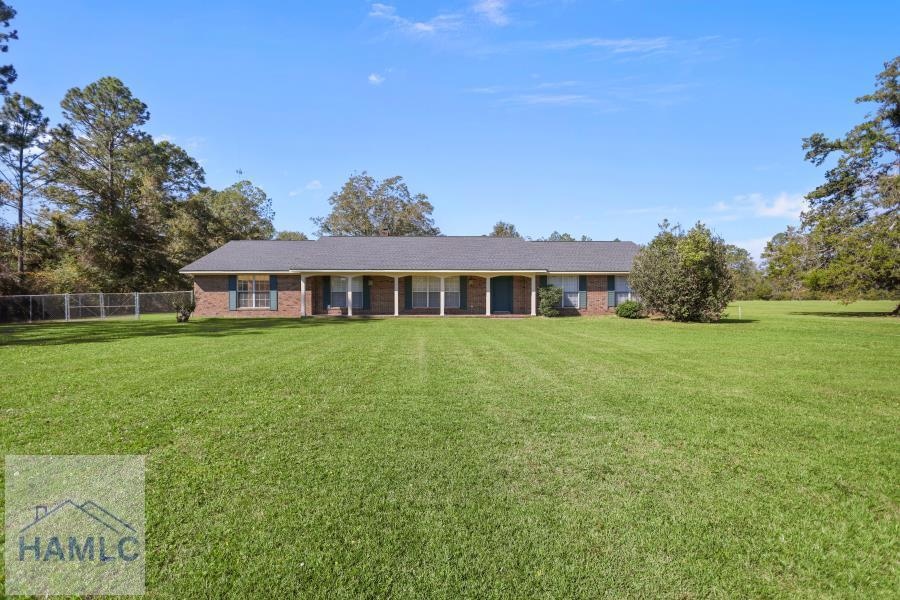
1602 Smith Rd Waycross, GA 31503
Estimated payment $1,955/month
Highlights
- No HOA
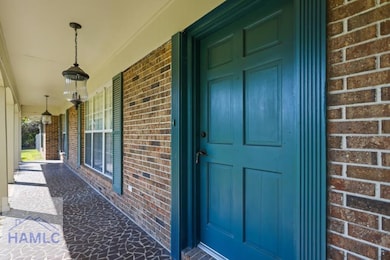
- Brick or Stone Mason
- Outdoor Storage
About This Home
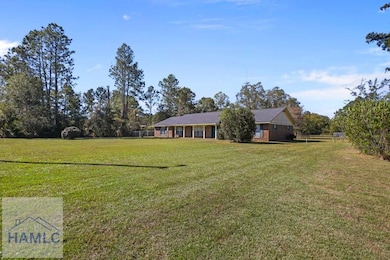
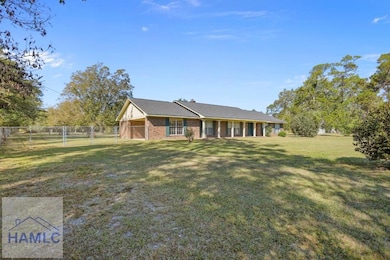
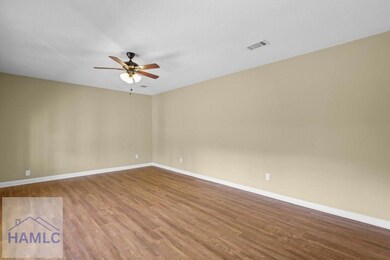
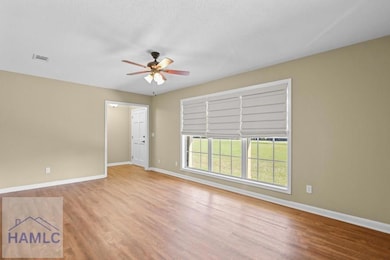
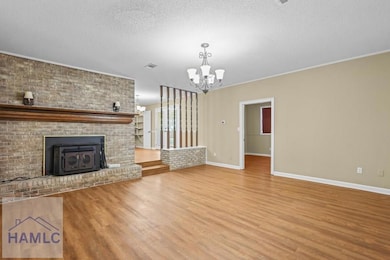
Welcome to 1602 Smith Road — a spacious 3-bedroom, 2.5-bath brick home nestled on 1.56 acres in Ware County. Built in 1976 and offering over 2,600 sq. ft. of living space, this property blends timeless character with comfortable country living — all while being just 5 miles, or about 10 minutes, from downtown Waycross. Inside, you'll find a large living area featuring a beautiful brick fireplace, perfect for cozy evenings at home. The layout provides ample room for entertaining, dining, and relaxation, while the home's solid construction and central heating/air ensure year-round comfort. Step outside to enjoy a fenced-in backyard shaded by several mature pecan trees — ideal for pets, play, or peaceful outdoor gatherings. A 20x36 pole shed (built in 2023) with power is ready for your workshop, equipment, or storage needs. Country charm, convenience, and space come together perfectly at this Smith Road address — a great opportunity for anyone seeking a peaceful setting close to town.
Listing Agent
Keller Williams Realty Golden Isles Brokerage Email: 9124346477, stevekunkel@kw.com License #433228 Listed on: 10/23/2025

Home Details
Home Type
- Single Family
Est. Annual Taxes
- $3,216
Year Built
- 1976
Lot Details
- 1.56 Acre Lot
- Back Yard Fenced
Home Design
- Brick or Stone Mason
- Slab Foundation
- Asbestos Shingle Roof
Interior Spaces
- 2,600 Sq Ft Home
- Living Room with Fireplace
Bedrooms and Bathrooms
- 3 Bedrooms
Outdoor Features
- Outdoor Storage
Community Details
- No Home Owners Association
Listing and Financial Details
- Assessor Parcel Number 078 018
Map
Home Values in the Area
Average Home Value in this Area
Tax History
| Year | Tax Paid | Tax Assessment Tax Assessment Total Assessment is a certain percentage of the fair market value that is determined by local assessors to be the total taxable value of land and additions on the property. | Land | Improvement |
|---|---|---|---|---|
| 2024 | $3,216 | $116,369 | $2,977 | $113,392 |
| 2023 | $2,995 | $66,529 | $2,769 | $63,760 |
| 2022 | $1,921 | $66,529 | $2,769 | $63,760 |
| 2021 | $1,151 | $36,747 | $2,214 | $34,533 |
| 2020 | $1,104 | $34,828 | $2,214 | $32,614 |
| 2019 | $1,064 | $32,910 | $2,214 | $30,696 |
| 2018 | $1,011 | $30,992 | $2,214 | $28,778 |
| 2017 | $1,405 | $45,099 | $2,214 | $42,885 |
| 2016 | $1,405 | $45,099 | $2,214 | $42,885 |
| 2015 | $1,433 | $45,591 | $2,706 | $42,885 |
| 2014 | $1,429 | $45,591 | $2,706 | $42,885 |
| 2013 | -- | $45,591 | $2,706 | $42,885 |
Property History
| Date | Event | Price | List to Sale | Price per Sq Ft |
|---|---|---|---|---|
| 10/23/2025 10/23/25 | For Sale | $320,000 | -- | $123 / Sq Ft |
Purchase History
| Date | Type | Sale Price | Title Company |
|---|---|---|---|
| Warranty Deed | $72,000 | -- | |
| Foreclosure Deed | $132,000 | -- | |
| Deed | $135,000 | -- | |
| Deed | $118,000 | -- | |
| Deed | -- | -- | |
| Deed | -- | -- | |
| Deed | -- | -- | |
| Deed | $92,000 | -- |
Mortgage History
| Date | Status | Loan Amount | Loan Type |
|---|---|---|---|
| Previous Owner | $90,000 | New Conventional |
Source: Hinesville Area Board of REALTORS®
MLS Number: 163555
APN: 078-018
- 1690 Smith Rd
- 3207 Bertran Trail
- 912 Smith Rd
- 00 Valdosta Hwy
- 0 Valdosta Hwy Unit 7562033
- 0 Valdosta Hwy Unit 10575594
- 0 Valdosta Hwy Unit 10502600
- 2580 Pennsylvania Ave
- 2565 New Jersey Ave
- 0 (Lot 4) Elmer Thrift Rd
- 0 (Lot 3) Elmer Thrift Rd
- 524 Smith Rd
- 2475 Minnesota Ave
- 2300 New York Ave
- 0 Anita St
- 400 Smith Rd
- 2199 Minnesota Ave
- Tbd Old Shop Rd
- 274 S Anita St
- 0 Anita South St