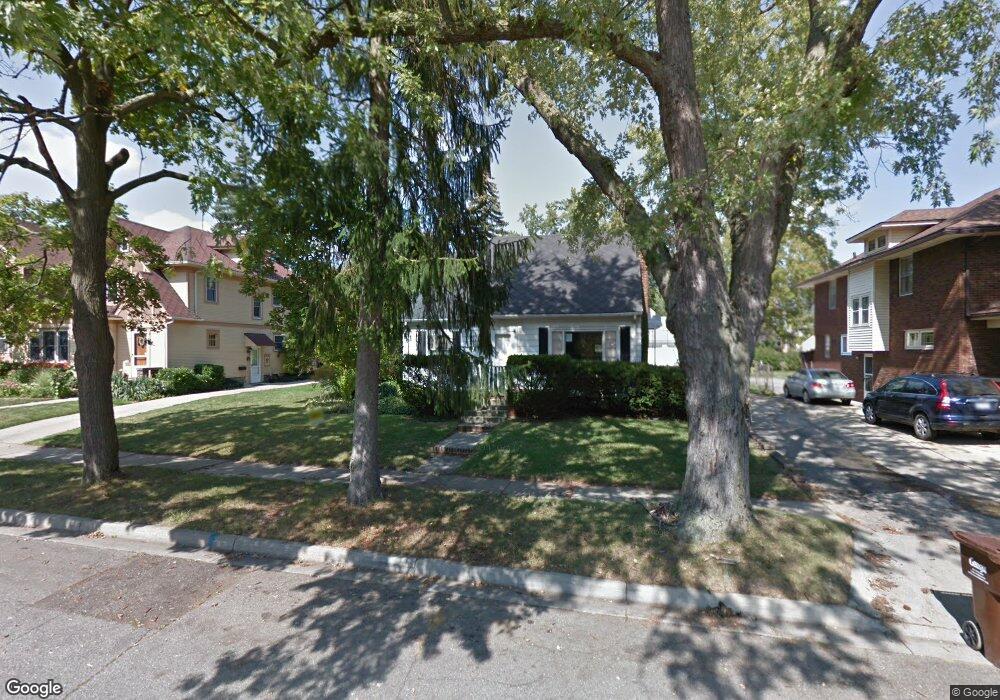
1602 W Shiawassee St Lansing, MI 48915
Westside NeighborhoodEstimated Value: $172,825 - $191,000
--
Bed
1
Bath
1,262
Sq Ft
$142/Sq Ft
Est. Value
About This Home
This home is located at 1602 W Shiawassee St, Lansing, MI 48915 and is currently estimated at $179,456, approximately $142 per square foot. 1602 W Shiawassee St is a home located in Ingham County with nearby schools including Riddle Elementary School, Pattengill Academy, and J.W. Sexton High School.
Ownership History
Date
Name
Owned For
Owner Type
Purchase Details
Closed on
Oct 18, 2004
Sold by
Sullivan Megan K
Bought by
Shipley Nathaniel W
Current Estimated Value
Home Financials for this Owner
Home Financials are based on the most recent Mortgage that was taken out on this home.
Original Mortgage
$106,000
Outstanding Balance
$49,305
Interest Rate
4.87%
Mortgage Type
Purchase Money Mortgage
Estimated Equity
$130,151
Purchase Details
Closed on
Nov 9, 2001
Sold by
Sullivan Rodney
Bought by
Sullivan Megan K
Purchase Details
Closed on
Jan 11, 1996
Sold by
Getzmeyer Thomas F and Getzmeyer Linda A
Bought by
Fillingham Megan K
Purchase Details
Closed on
Oct 1, 1994
Sold by
Katowitz Janet A
Bought by
Getzmeyer Thomas F and Getzmeyer Linda A
Create a Home Valuation Report for This Property
The Home Valuation Report is an in-depth analysis detailing your home's value as well as a comparison with similar homes in the area
Home Values in the Area
Average Home Value in this Area
Purchase History
| Date | Buyer | Sale Price | Title Company |
|---|---|---|---|
| Shipley Nathaniel W | $132,500 | Tri Title Agency | |
| Sullivan Megan K | -- | -- | |
| Fillingham Megan K | $64,000 | -- | |
| Getzmeyer Thomas F | $62,500 | -- |
Source: Public Records
Mortgage History
| Date | Status | Borrower | Loan Amount |
|---|---|---|---|
| Open | Shipley Nathaniel W | $106,000 | |
| Closed | Shipley Nathaniel W | $19,875 |
Source: Public Records
Tax History Compared to Growth
Tax History
| Year | Tax Paid | Tax Assessment Tax Assessment Total Assessment is a certain percentage of the fair market value that is determined by local assessors to be the total taxable value of land and additions on the property. | Land | Improvement |
|---|---|---|---|---|
| 2025 | $3,236 | $80,000 | $9,800 | $70,200 |
| 2024 | $26 | $75,700 | $9,800 | $65,900 |
| 2023 | $3,034 | $67,700 | $9,800 | $57,900 |
| 2022 | $2,734 | $66,900 | $10,500 | $56,400 |
| 2021 | $2,678 | $60,200 | $9,800 | $50,400 |
| 2020 | $2,661 | $56,600 | $9,800 | $46,800 |
| 2019 | $2,551 | $51,900 | $9,800 | $42,100 |
| 2018 | $2,391 | $49,100 | $9,800 | $39,300 |
| 2017 | $2,364 | $49,100 | $9,800 | $39,300 |
| 2016 | $2,189 | $43,600 | $9,800 | $33,800 |
| 2015 | $2,189 | $40,700 | $19,500 | $21,200 |
| 2014 | $2,189 | $38,900 | $20,000 | $18,900 |
Source: Public Records
Map
Nearby Homes
- 1528 W Shiawassee St
- 314 Memphis St
- 1632 Inverness Ave
- 425 N Jenison Ave
- 1314 W Ottawa St
- 1313 S Genesee Dr
- 1812 S Genesee Dr
- 518 N Jenison Ave
- 1804 W Michigan Ave
- 1319 W Michigan Ave
- 1232 W Michigan Ave
- 1233 W Michigan Ave
- 201 S Jenison Ave
- 1234 W Allegan St
- 1128 W Michigan Ave
- 2009 Drexel Rd
- 416 N Martin Luther King Junior Blvd
- 418 N Martin Luther King Junior Blvd
- 422 N Martin Luther King Junior Blvd
- 1229 W Saginaw St
- 1608 W Shiawassee St
- 1524 W Shiawassee St
- 1612 W Shiawassee St
- 1520 W Shiawassee St
- 1616 W Shiawassee St
- 1615 S Genesee Dr
- 1611 S Genesee Dr
- 1617 S Genesee Dr
- 1620 W Shiawassee St
- 1600 Inverness Ave
- 1515 Osborn Rd
- 1525 Osborn Rd
- 1609 S Genesee Dr
- 1619 S Genesee Dr
- 1622 W Shiawassee St
- 1509 Osborn Rd
- 1621 W Shiawassee St
- 1527 Inverness Ave
- 1623 S Genesee Dr
- 1610 Inverness Ave