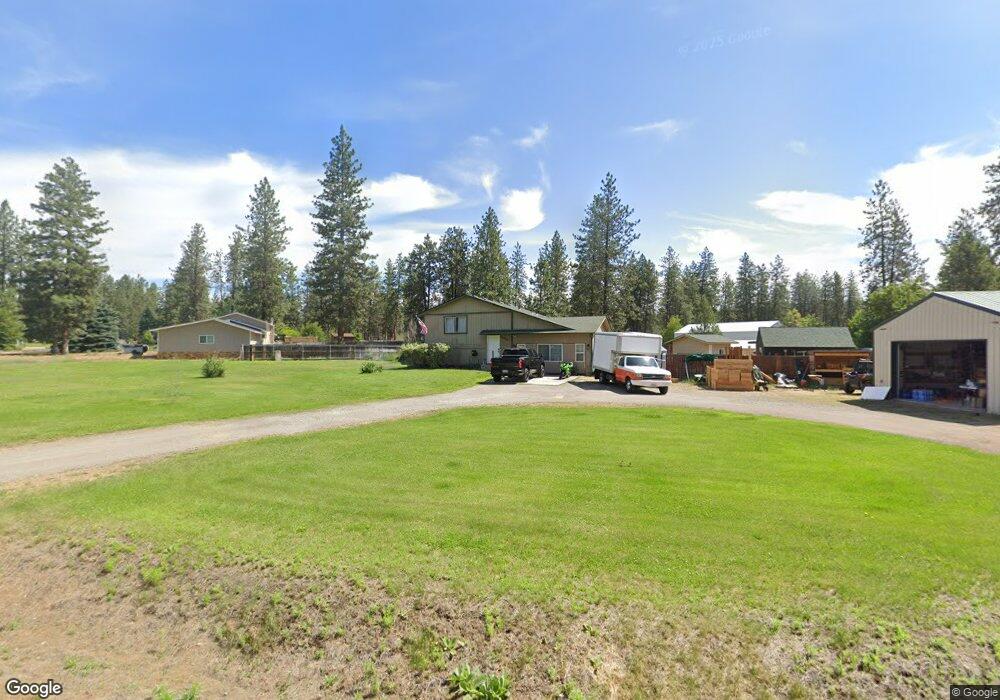
16026 N Tamarac Ln Nine Mile Falls, WA 99026
Estimated Value: $366,000 - $464,000
3
Beds
2
Baths
1,700
Sq Ft
$250/Sq Ft
Est. Value
About This Home
This home is located at 16026 N Tamarac Ln, Nine Mile Falls, WA 99026 and is currently estimated at $424,261, approximately $249 per square foot. 16026 N Tamarac Ln is a home located in Stevens County with nearby schools including Lakeside High School.
Ownership History
Date
Name
Owned For
Owner Type
Purchase Details
Closed on
Jun 9, 2022
Sold by
Mercer Joseph M
Bought by
Mercer Joseph M
Current Estimated Value
Home Financials for this Owner
Home Financials are based on the most recent Mortgage that was taken out on this home.
Original Mortgage
$285,000
Outstanding Balance
$271,249
Interest Rate
5.3%
Mortgage Type
New Conventional
Estimated Equity
$153,012
Purchase Details
Closed on
Oct 22, 2018
Sold by
Wicklund Allan and Wicklund Debra M
Bought by
Mercer Joseph M and Mercer Lindsey A
Home Financials for this Owner
Home Financials are based on the most recent Mortgage that was taken out on this home.
Original Mortgage
$175,010
Interest Rate
4.6%
Mortgage Type
FHA
Purchase Details
Closed on
Sep 10, 2007
Sold by
Whitmore Ryan Robert and Whitmore Ryan R
Bought by
Wicklund Allan and Wicklund Debra M
Create a Home Valuation Report for This Property
The Home Valuation Report is an in-depth analysis detailing your home's value as well as a comparison with similar homes in the area
Home Values in the Area
Average Home Value in this Area
Purchase History
| Date | Buyer | Sale Price | Title Company |
|---|---|---|---|
| Mercer Joseph M | -- | Frontier Title & Escrow | |
| Mercer Joseph M | $215,000 | Frontier Title & Escrow | |
| Wicklund Allan | $152,500 | Columbia Title Company |
Source: Public Records
Mortgage History
| Date | Status | Borrower | Loan Amount |
|---|---|---|---|
| Open | Mercer Joseph M | $285,000 | |
| Previous Owner | Mercer Joseph M | $175,010 |
Source: Public Records
Tax History Compared to Growth
Tax History
| Year | Tax Paid | Tax Assessment Tax Assessment Total Assessment is a certain percentage of the fair market value that is determined by local assessors to be the total taxable value of land and additions on the property. | Land | Improvement |
|---|---|---|---|---|
| 2024 | $3,473 | $376,878 | $50,000 | $326,878 |
| 2023 | $3,318 | $373,131 | $40,000 | $333,131 |
| 2022 | $3,084 | $324,887 | $40,000 | $284,887 |
| 2021 | $2,097 | $210,277 | $30,000 | $180,277 |
| 2020 | $2,483 | $210,277 | $30,000 | $180,277 |
| 2019 | $1,834 | $208,274 | $30,000 | $178,274 |
| 2018 | $1,807 | $151,135 | $30,000 | $121,135 |
| 2017 | $1,667 | $138,635 | $30,000 | $108,635 |
| 2016 | $1,361 | $138,635 | $30,000 | $108,635 |
| 2015 | -- | $107,935 | $30,000 | $77,935 |
| 2013 | -- | $107,935 | $30,000 | $77,935 |
Source: Public Records
Map
Nearby Homes
- 12321 Quail Run Way
- 129 E Wynot Dr
- 11472 W Tamarac Ln
- 209 E Franklin Dr
- 16406 N Tamarac Ln
- 12324 W Meadowview Ln
- 16418 N Sunnyvale Dr
- 314 E Shore Rd
- 16610 N Suncrest Dr
- 318 E Shore Rd
- Lot 26 Legacy Way
- Lot 24 Legacy Way
- Lot 21 Legacy Way
- Lot 20 Legacy Way
- Lot 19 Legacy Way
- Lot 22 Legacy Way
- 11280 W Meadowview Ln
- Lot 9 Shoreline Way
- Lot 8 Shoreline Way
- Lot 7 Shoreline Way
- 16100 N Tamarac Ln
- 11613 W Tamarac Ln
- 16024 N Tamarac Ct
- 11596 W Tamarac Ln
- 11601 W Tamarac Ln
- 16035 N Tamarac Ln
- 16108 N Tamarac Ln
- 16111 N Tamarac Ln
- 11593 W Tamarac Ln
- 16035 N Tamarac Ct
- 11580 W Tamarac Ln
- 16010 N Tamarac Ct
- 11587 W Tamarac Ln
- 16119 N Tamarac Ln
- 16118 N Tamarac Ln
- 16025 N Tamarac Ct
- 16007 N Tamarac Ct
- 11562 W Tamarac Ln
- 11583 W Meadowview Ln
- 12208 W Sunridge Dr