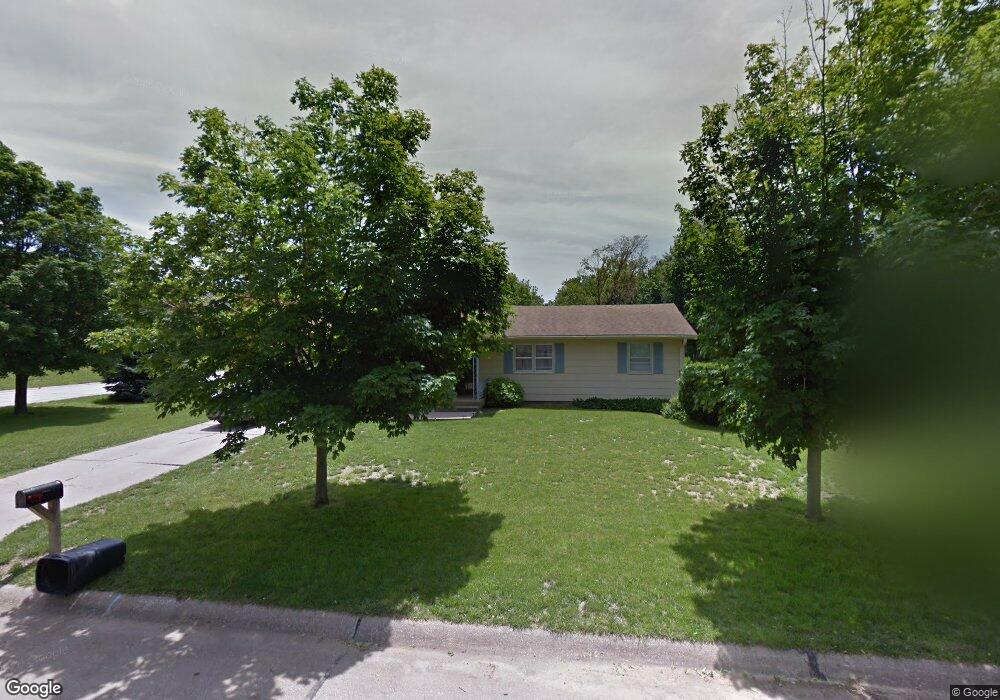
1603 16th St Auburn, NE 68305
Estimated Value: $125,000 - $165,690
3
Beds
1
Bath
2,480
Sq Ft
$59/Sq Ft
Est. Value
About This Home
This home is located at 1603 16th St, Auburn, NE 68305 and is currently estimated at $145,173, approximately $58 per square foot. 1603 16th St is a home located in Nemaha County with nearby schools including Calvert Elementary School, Auburn Middle School, and Auburn High School.
Ownership History
Date
Name
Owned For
Owner Type
Purchase Details
Closed on
May 9, 2018
Sold by
Jpmorgan Chase Bank
Bought by
Maybee David Ray
Current Estimated Value
Home Financials for this Owner
Home Financials are based on the most recent Mortgage that was taken out on this home.
Original Mortgage
$80,000
Outstanding Balance
$69,041
Interest Rate
4.5%
Mortgage Type
Future Advance Clause Open End Mortgage
Estimated Equity
$76,132
Purchase Details
Closed on
Jan 22, 2018
Sold by
Brink Edward E
Bought by
Jp Morgan Chase Bank National Associatio
Create a Home Valuation Report for This Property
The Home Valuation Report is an in-depth analysis detailing your home's value as well as a comparison with similar homes in the area
Home Values in the Area
Average Home Value in this Area
Purchase History
| Date | Buyer | Sale Price | Title Company |
|---|---|---|---|
| Maybee David Ray | $55,000 | None Available | |
| Jp Morgan Chase Bank National Associatio | $58,400 | None Available |
Source: Public Records
Mortgage History
| Date | Status | Borrower | Loan Amount |
|---|---|---|---|
| Open | Maybee David Ray | $80,000 |
Source: Public Records
Tax History Compared to Growth
Tax History
| Year | Tax Paid | Tax Assessment Tax Assessment Total Assessment is a certain percentage of the fair market value that is determined by local assessors to be the total taxable value of land and additions on the property. | Land | Improvement |
|---|---|---|---|---|
| 2024 | $2,077 | $119,135 | $10,200 | $108,935 |
| 2023 | $1,874 | $96,413 | $10,200 | $86,213 |
| 2022 | $1,865 | $96,413 | $10,200 | $86,213 |
| 2021 | $1,844 | $96,413 | $10,200 | $86,213 |
| 2020 | $1,874 | $96,413 | $10,200 | $86,213 |
| 2019 | $1,590 | $80,085 | $9,180 | $70,905 |
| 2017 | $1,520 | $80,085 | $9,180 | $70,905 |
| 2016 | $1,520 | $80,085 | $9,180 | $70,905 |
| 2015 | $1,521 | $80,085 | $9,180 | $70,905 |
| 2014 | $1,563 | $80,085 | $9,180 | $70,905 |
Source: Public Records
Map
Nearby Homes