1603 Coral Rd Waycross, GA 31501
Estimated Value: $310,000 - $338,000
4
Beds
3
Baths
2,448
Sq Ft
$130/Sq Ft
Est. Value
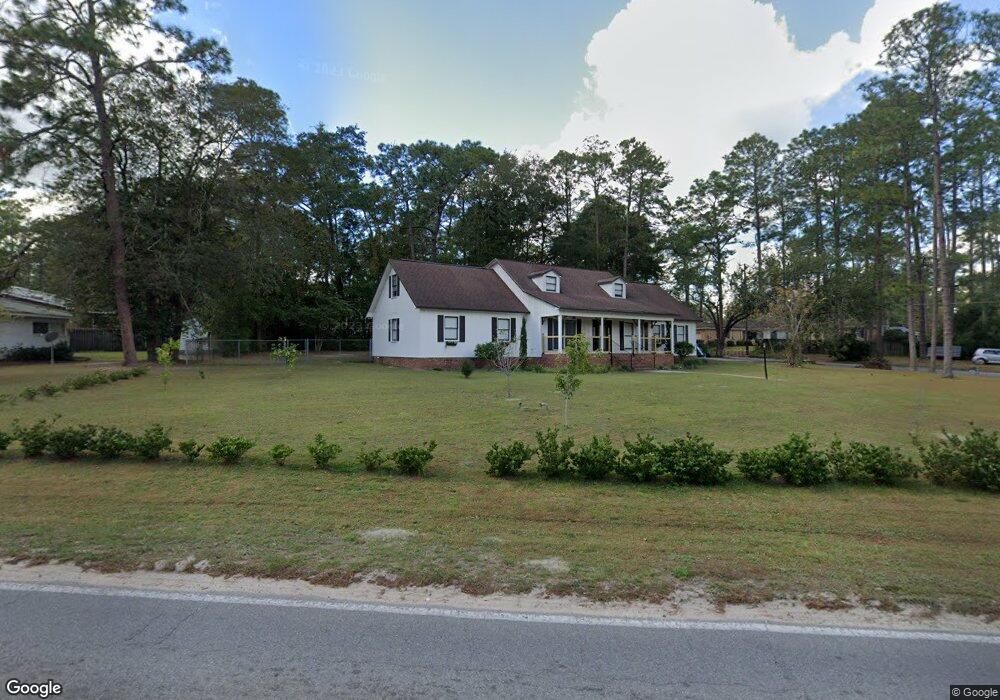
About This Home
This home is located at 1603 Coral Rd, Waycross, GA 31501 and is currently estimated at $318,454, approximately $130 per square foot. 1603 Coral Rd is a home located in Ware County with nearby schools including Center Elementary School, Waycross Middle School, and Ware County High School.
Ownership History
Date
Name
Owned For
Owner Type
Purchase Details
Closed on
Oct 17, 2023
Sold by
Nunez Jenny V
Bought by
Boyett Brent
Current Estimated Value
Home Financials for this Owner
Home Financials are based on the most recent Mortgage that was taken out on this home.
Original Mortgage
$304,385
Outstanding Balance
$298,478
Interest Rate
7.19%
Mortgage Type
FHA
Estimated Equity
$19,976
Purchase Details
Closed on
Aug 14, 2017
Sold by
Woodard Davy
Bought by
Nunez Jenny V
Home Financials for this Owner
Home Financials are based on the most recent Mortgage that was taken out on this home.
Original Mortgage
$157,003
Interest Rate
3.62%
Mortgage Type
FHA
Purchase Details
Closed on
Nov 16, 2016
Sold by
Mike
Bought by
Woodard Davy D
Purchase Details
Closed on
Aug 11, 2016
Sold by
Swicord Betty
Bought by
Alday Mike
Purchase Details
Closed on
Jul 11, 2003
Sold by
Alday Betty S and Youngblood Jack
Bought by
Youngblood Betty S
Purchase Details
Closed on
Nov 8, 2002
Sold by
Bradshaw Cecelia V
Bought by
Alday Betty S and Youngblood Jack E
Create a Home Valuation Report for This Property
The Home Valuation Report is an in-depth analysis detailing your home's value as well as a comparison with similar homes in the area
Home Values in the Area
Average Home Value in this Area
Purchase History
| Date | Buyer | Sale Price | Title Company |
|---|---|---|---|
| Boyett Brent | $310,000 | -- | |
| Nunez Jenny V | $159,900 | -- | |
| Woodard Davy D | $70,000 | -- | |
| Alday Mike | -- | -- | |
| Youngblood Betty S | -- | -- | |
| Alday Betty S | $125,000 | -- |
Source: Public Records
Mortgage History
| Date | Status | Borrower | Loan Amount |
|---|---|---|---|
| Open | Boyett Brent | $304,385 | |
| Previous Owner | Nunez Jenny V | $157,003 |
Source: Public Records
Tax History Compared to Growth
Tax History
| Year | Tax Paid | Tax Assessment Tax Assessment Total Assessment is a certain percentage of the fair market value that is determined by local assessors to be the total taxable value of land and additions on the property. | Land | Improvement |
|---|---|---|---|---|
| 2024 | $4,544 | $114,108 | $10,170 | $103,938 |
| 2023 | $3,935 | $81,287 | $5,828 | $75,459 |
| 2022 | $3,246 | $81,460 | $5,828 | $75,632 |
| 2021 | $2,845 | $65,791 | $5,828 | $59,963 |
| 2020 | $2,867 | $65,791 | $5,828 | $59,963 |
| 2019 | $2,139 | $48,384 | $5,828 | $42,556 |
| 2018 | $2,084 | $46,689 | $5,828 | $40,861 |
| 2017 | $1,768 | $42,054 | $5,828 | $36,226 |
| 2016 | $1,768 | $42,054 | $5,828 | $36,226 |
| 2015 | $1,779 | $42,053 | $5,828 | $36,226 |
| 2014 | $1,775 | $42,053 | $5,828 | $36,226 |
| 2013 | -- | $42,053 | $5,827 | $36,225 |
Source: Public Records
Map
Nearby Homes
- 1400 E Cherokee Dr
- 1621 Camellia Dr
- 00 Seminole Trail
- 1502 Seminole Trail
- 1703 Rainbow Dr
- Lot 3 City Blvd
- 1504 Danora Dr
- 1206 Morningside Dr
- 1715 City Blvd
- 1103 Kontz Ave
- 1617 Moss Creek Rd
- 1011 Cherokee Cir
- 1100 Euclid Ave
- 1002 Cherokee Cir
- 1009 Euclid Ave
- 1002 Baltimore Ave
- 1001 Coral Rd
- 1622 Booth St
- 1204 Richmond Ave
- 1205 Dean Dr
- 1601 Coral Rd
- 1701 Coral Rd
- 1614 Camellia Dr
- 1602 Coral Rd
- 1405 Seminole Trail
- 1608 Coral Rd
- 1403 Seminole Trail
- E E Cherokee Dr
- 1703 Coral Rd
- 1624 Camellia Dr
- 1401 Seminole Trail
- 1615 Camellia Dr
- 1613 Camellia Dr
- 1619 Camellia Dr
- 1312 Coral Rd
- 1304 E Cherokee Dr
- 1508 E Cherokee Dr
- 1702 Coral Rd
- 0 Camellia Dr
- 1623 Camellia Dr