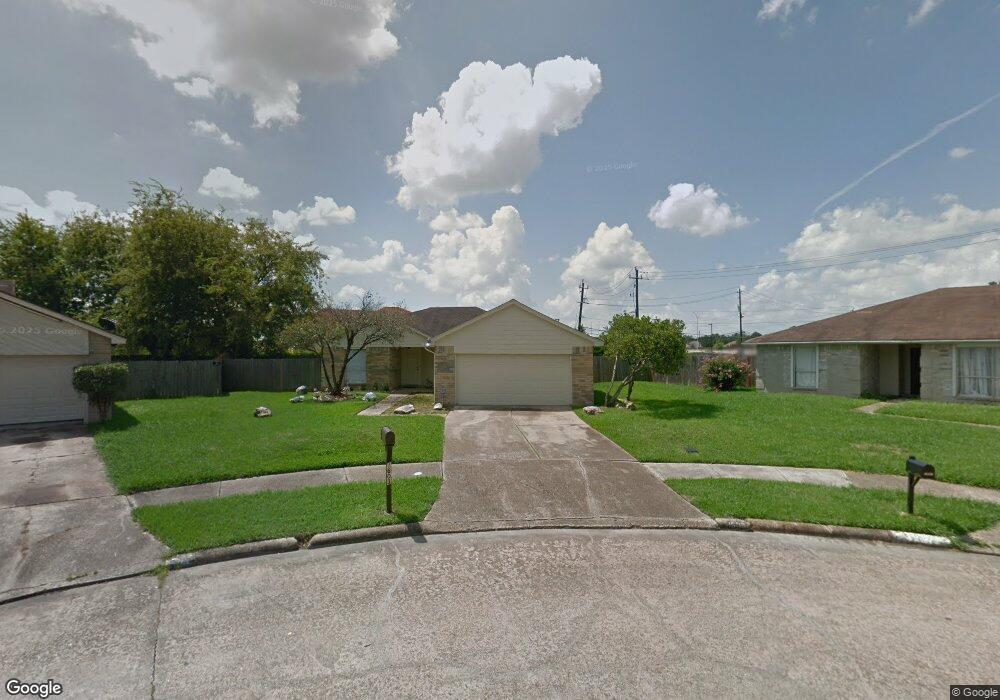
1603 Evesham Dr Houston, TX 77015
Estimated Value: $206,000 - $224,000
3
Beds
2
Baths
1,423
Sq Ft
$150/Sq Ft
Est. Value
About This Home
This home is located at 1603 Evesham Dr, Houston, TX 77015 and is currently estimated at $212,864, approximately $149 per square foot. 1603 Evesham Dr is a home located in Harris County with nearby schools including James B. Havard Elementary School, Cobb 6th Grade Campus, and North Shore Middle School.
Ownership History
Date
Name
Owned For
Owner Type
Purchase Details
Closed on
Mar 31, 2014
Sold by
Fannie Mae
Bought by
Martinez Madrigal Juan Manuel
Current Estimated Value
Home Financials for this Owner
Home Financials are based on the most recent Mortgage that was taken out on this home.
Original Mortgage
$93,769
Outstanding Balance
$71,709
Interest Rate
4.5%
Mortgage Type
FHA
Estimated Equity
$141,155
Purchase Details
Closed on
Dec 4, 2013
Sold by
Jpmorgan Chase Bank Na
Bought by
Fannie Mae and Federal National Mortgage Association
Purchase Details
Closed on
Sep 3, 2013
Sold by
Marroquin Arturo
Bought by
Jpmorgan Chase Bank N A
Purchase Details
Closed on
Nov 22, 2005
Sold by
Palma Carlos A and Palma Jenny M
Bought by
Marroquin Arturo
Home Financials for this Owner
Home Financials are based on the most recent Mortgage that was taken out on this home.
Original Mortgage
$83,000
Interest Rate
6.06%
Mortgage Type
Fannie Mae Freddie Mac
Create a Home Valuation Report for This Property
The Home Valuation Report is an in-depth analysis detailing your home's value as well as a comparison with similar homes in the area
Home Values in the Area
Average Home Value in this Area
Purchase History
| Date | Buyer | Sale Price | Title Company |
|---|---|---|---|
| Martinez Madrigal Juan Manuel | -- | None Available | |
| Fannie Mae | -- | None Available | |
| Jpmorgan Chase Bank N A | $61,385 | None Available | |
| Marroquin Arturo | -- | First American Title |
Source: Public Records
Mortgage History
| Date | Status | Borrower | Loan Amount |
|---|---|---|---|
| Open | Martinez Madrigal Juan Manuel | $93,769 | |
| Previous Owner | Marroquin Arturo | $83,000 |
Source: Public Records
Tax History
| Year | Tax Paid | Tax Assessment Tax Assessment Total Assessment is a certain percentage of the fair market value that is determined by local assessors to be the total taxable value of land and additions on the property. | Land | Improvement |
|---|---|---|---|---|
| 2025 | $1,965 | $205,620 | $45,288 | $160,332 |
| 2024 | $1,965 | $223,007 | $45,288 | $177,719 |
| 2023 | $1,965 | $231,353 | $45,288 | $186,065 |
| 2022 | $3,377 | $188,085 | $45,288 | $142,797 |
| 2021 | $3,380 | $167,165 | $45,288 | $121,877 |
| 2020 | $3,299 | $138,495 | $45,288 | $93,207 |
| 2019 | $3,178 | $129,445 | $45,288 | $84,157 |
| 2018 | $804 | $95,119 | $19,980 | $75,139 |
| 2017 | $2,940 | $95,119 | $19,980 | $75,139 |
| 2016 | $2,940 | $95,119 | $19,980 | $75,139 |
| 2015 | $2,494 | $88,040 | $9,990 | $78,050 |
| 2014 | $2,494 | $78,067 | $9,990 | $68,077 |
Source: Public Records
Map
Nearby Homes
- 1714 Merton Dr
- 14615 Hollow Ash Ct
- 14847 Shottery Dr
- 14615 Twisted Pecan Ct
- 14854 Shottery Dr
- 1423 Seafield Dr
- 14830 Croxton Dr
- 1915 Aldates Dr
- 1346 Castle Glen Dr
- 1342 Castle Glen Dr
- 14615 Woodmaple Ct
- 1303 Sterling Green Ct
- 1331 Castle Glen Dr
- 14814 S Silver Green Dr
- 310 Banter Trails Dr
- 14835 Scotter Dr
- 151 E Forest Ln
- 15602 Egret Field Ln
- 234 Wentworth Park Dr
- 15302 Plantation Glen Park
- 1607 Evesham Dr
- 1611 Evesham Dr
- 1606 Evesham Dr
- 1619 Evesham Dr
- 1614 Evesham Dr
- 14802 Shottery Dr
- 1618 Evesham Dr
- 1603 Merton Dr
- 1623 Evesham Dr
- 1622 Evesham Dr
- 1607 Merton Dr
- 1627 Evesham Dr
- 14806 Shottery Dr
- 1626 Evesham Dr
- 1611 Merton Dr
- 1631 Evesham Dr
- 1630 Evesham Dr
- 14811 Peachmeadow Ln
- 14810 Shottery Dr
- 14807 Peachmeadow Ln
Your Personal Tour Guide
Ask me questions while you tour the home.