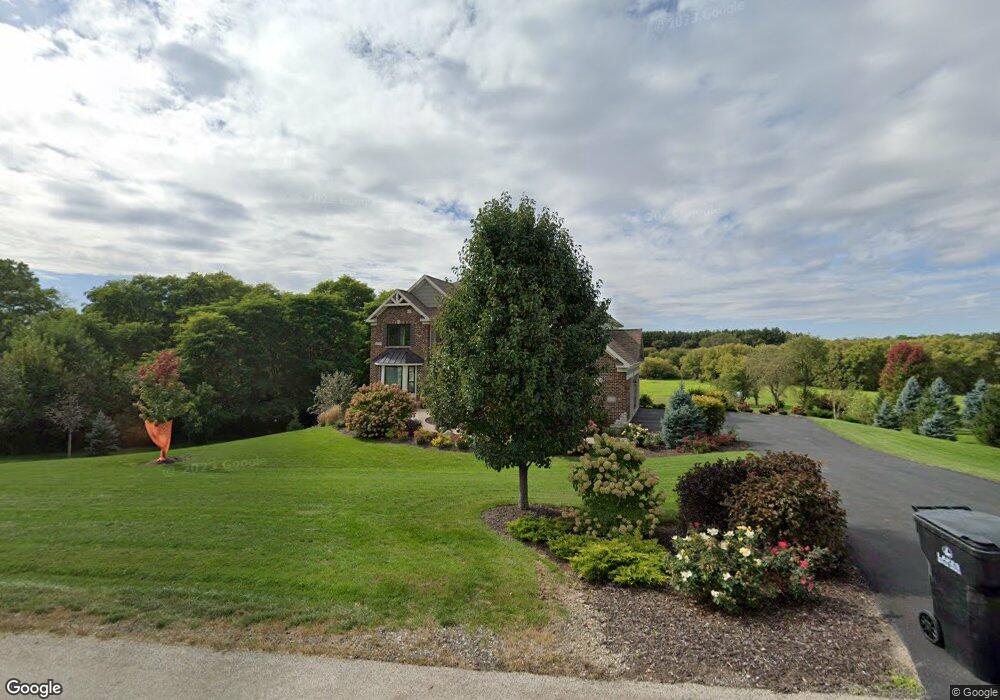
1603 Ginko Ct McHenry, IL 60050
Estimated Value: $588,000 - $767,875
--
Bed
3
Baths
3,790
Sq Ft
$179/Sq Ft
Est. Value
About This Home
This home is located at 1603 Ginko Ct, McHenry, IL 60050 and is currently estimated at $680,219, approximately $179 per square foot. 1603 Ginko Ct is a home located in McHenry County with nearby schools including Valley View Elementary School, Parkland School, and McHenry Community High School - Upper Campus.
Ownership History
Date
Name
Owned For
Owner Type
Purchase Details
Closed on
Mar 29, 2013
Sold by
Scherston Real Estate Investments Llc
Bought by
Simon Jeremy E and Simson Michelle L
Current Estimated Value
Home Financials for this Owner
Home Financials are based on the most recent Mortgage that was taken out on this home.
Original Mortgage
$48,750
Outstanding Balance
$34,489
Interest Rate
3.52%
Mortgage Type
Unknown
Estimated Equity
$645,730
Purchase Details
Closed on
Jan 5, 2012
Sold by
Chicago Title Land Trust Company
Bought by
American Chartered Bank
Purchase Details
Closed on
Jul 15, 1998
Sold by
First Midwest Trust Company Natl Assn
Bought by
Cole Taylor Bank and Trust #97-4326
Home Financials for this Owner
Home Financials are based on the most recent Mortgage that was taken out on this home.
Original Mortgage
$63,000
Interest Rate
8.5%
Create a Home Valuation Report for This Property
The Home Valuation Report is an in-depth analysis detailing your home's value as well as a comparison with similar homes in the area
Home Values in the Area
Average Home Value in this Area
Purchase History
| Date | Buyer | Sale Price | Title Company |
|---|---|---|---|
| Simon Jeremy E | $65,000 | Chicago Title | |
| American Chartered Bank | -- | None Available | |
| Cole Taylor Bank | $105,000 | -- |
Source: Public Records
Mortgage History
| Date | Status | Borrower | Loan Amount |
|---|---|---|---|
| Open | Simon Jeremy E | $48,750 | |
| Previous Owner | Cole Taylor Bank | $63,000 |
Source: Public Records
Tax History Compared to Growth
Tax History
| Year | Tax Paid | Tax Assessment Tax Assessment Total Assessment is a certain percentage of the fair market value that is determined by local assessors to be the total taxable value of land and additions on the property. | Land | Improvement |
|---|---|---|---|---|
| 2024 | $17,065 | $221,358 | $60,787 | $160,571 |
| 2023 | $16,599 | $198,314 | $54,459 | $143,855 |
| 2022 | $13,012 | $151,483 | $50,523 | $100,960 |
| 2021 | $12,397 | $141,072 | $47,051 | $94,021 |
| 2020 | $11,991 | $135,192 | $45,090 | $90,102 |
| 2019 | $12,830 | $138,912 | $42,816 | $96,096 |
| 2018 | $13,971 | $135,845 | $40,874 | $94,971 |
| 2017 | $14,880 | $140,481 | $38,361 | $102,120 |
| 2016 | $15,293 | $138,834 | $35,851 | $102,983 |
| 2013 | -- | $21,666 | $21,666 | $0 |
Source: Public Records
Map
Nearby Homes
- 8508 Illinois 120
- 7318 W Il Route 120
- 7409 Burning Tree Dr
- 2706 E Chestnut Dr
- 2708 E Chestnut Dr
- 7015 Burning Tree Cir
- 8019 Wonder View Dr
- 6562 Walnut Dr
- 6564 Walnut Dr
- 7408 Forest Oak Dr
- 7402 Forest Oak Dr
- 7316 Forest Oak Dr
- 7319 Forest Oak Dr
- 7407 Forest Oak Dr
- 7304 Forest Oak Dr
- 7220 Forest Oak Dr
- 2904 E Chestnut Dr
- 6564 Walnut Ct
- 2978 E Hickory Dr
- 6562 Walnut Ct
- 1615 Ginko Ct
- 1515 Burr Oak Ct
- 7907 Burr Oak Dr
- 1703 Ginko Ct
- 1503 Burr Oak Ct
- 7814 Burr Oak Dr
- 1704 Ginko Ct
- 1512 Burr Oak Ct
- 1413 Burr Oak Ct
- 7817 Burr Oak Dr
- 7804 Burr Oak Dr
- 1519 N Ridge Rd
- 1715 Bull Ridge Dr
- 7716 Burr Oak Dr
- 1807 Bull Ridge Dr
- 1410 Burr Oak Ct
- 7715 Burr Oak Dr
- 1716 Bull Ridge Dr
- 7706 Burr Oak Dr
- 1815 Bull Ridge Dr