1603 Gladiola St Hoschton, GA 30548
Estimated Value: $747,000 - $831,000
4
Beds
4
Baths
3,891
Sq Ft
$207/Sq Ft
Est. Value
About This Home
This home is located at 1603 Gladiola St, Hoschton, GA 30548 and is currently estimated at $803,693, approximately $206 per square foot. 1603 Gladiola St is a home located in Barrow County with nearby schools including Bramlett Elementary School, Russell Middle School, and Winder-Barrow High School.
Ownership History
Date
Name
Owned For
Owner Type
Purchase Details
Closed on
Oct 3, 2008
Sold by
Alpha Bank & Trust
Bought by
Roach Jeremy and Roach Crystal
Current Estimated Value
Home Financials for this Owner
Home Financials are based on the most recent Mortgage that was taken out on this home.
Original Mortgage
$402,550
Outstanding Balance
$259,192
Interest Rate
5.78%
Mortgage Type
New Conventional
Estimated Equity
$544,501
Purchase Details
Closed on
May 6, 2008
Sold by
Embry Hmbldrs Llc
Bought by
Alpha Bk
Purchase Details
Closed on
Oct 31, 2006
Sold by
Walthoo Development Llc
Bought by
Embry Homebuilders Llc
Purchase Details
Closed on
May 18, 2006
Sold by
Embry Homebuilders Llc
Bought by
Arborwood Development Inc
Purchase Details
Closed on
May 18, 2005
Bought by
Walthoo Development Llc
Create a Home Valuation Report for This Property
The Home Valuation Report is an in-depth analysis detailing your home's value as well as a comparison with similar homes in the area
Home Values in the Area
Average Home Value in this Area
Purchase History
| Date | Buyer | Sale Price | Title Company |
|---|---|---|---|
| Roach Jeremy | $415,000 | -- | |
| Alpha Bk | $1,233,000 | -- | |
| Alpha Bank & Trust | -- | -- | |
| Embry Homebuilders Llc | $109,200 | -- | |
| Arborwood Development Inc | -- | -- | |
| Walthoo Development Llc | -- | -- |
Source: Public Records
Mortgage History
| Date | Status | Borrower | Loan Amount |
|---|---|---|---|
| Open | Roach Jeremy | $402,550 |
Source: Public Records
Tax History Compared to Growth
Tax History
| Year | Tax Paid | Tax Assessment Tax Assessment Total Assessment is a certain percentage of the fair market value that is determined by local assessors to be the total taxable value of land and additions on the property. | Land | Improvement |
|---|---|---|---|---|
| 2024 | $7,241 | $296,920 | $35,200 | $261,720 |
| 2023 | $6,819 | $297,720 | $35,200 | $262,520 |
| 2022 | $5,946 | $211,028 | $35,200 | $175,828 |
| 2021 | $6,303 | $211,028 | $35,200 | $175,828 |
| 2020 | $6,315 | $211,028 | $35,200 | $175,828 |
| 2019 | $6,428 | $211,028 | $35,200 | $175,828 |
| 2018 | $6,309 | $208,710 | $35,200 | $173,510 |
| 2017 | $5,437 | $186,746 | $35,200 | $151,546 |
| 2016 | $5,182 | $173,100 | $35,200 | $137,900 |
| 2015 | $5,207 | $173,100 | $35,200 | $137,900 |
| 2014 | -- | $156,576 | $17,248 | $139,328 |
| 2013 | -- | $142,453 | $17,248 | $125,205 |
Source: Public Records
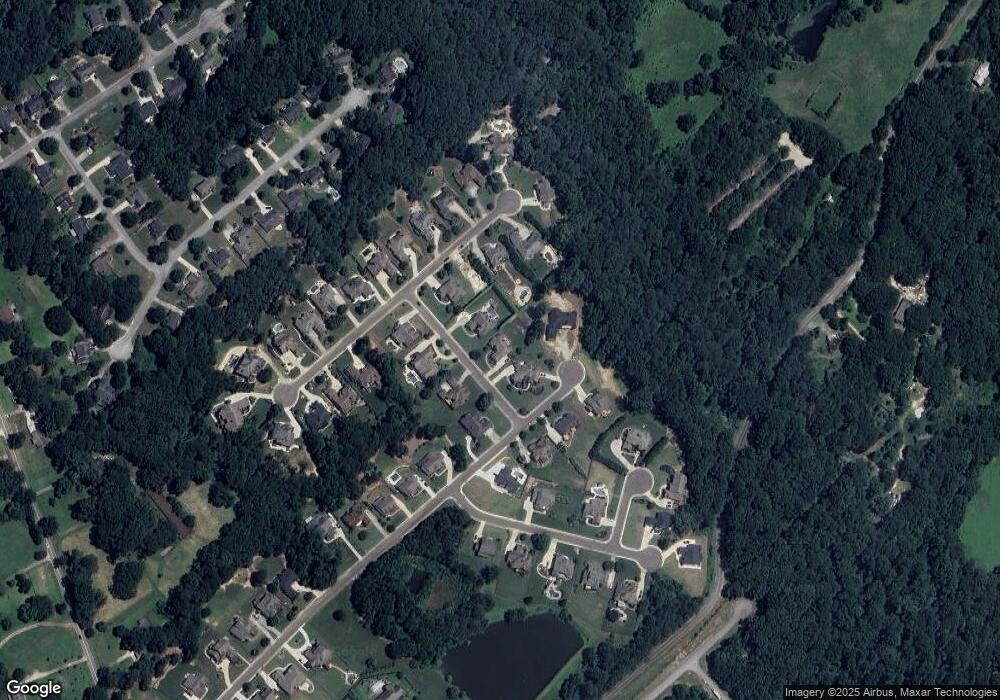
Map
Nearby Homes
- 2711 Wildflower Way
- 1151 Emperor Ln
- 1841 Hidden Creek Dr
- 1833 Hidden Creek Dr
- 1646 Thomas Dr
- 1035 Fleeman Rd
- 1678 Thomas Dr
- 5364 Wheeler Run Dr
- 940 Chateau Forest Rd
- 1444 Elliotts Ln
- 1438 Elliotts Ln
- 1226 Summer Ln
- 5747 Wheeler Rd
- 1303 Merlot Ct
- 4525 Legacy Ct
- 1431 Winding Ridge Trail
- 1005 Chateau Forest Rd
- 5171 Woodline
- 1605 Gladiola St
- 1601 Gladiola St
- 2704 Wildflower Way
- 2708 Wildflower Way
- 2445 Sunflower Dr Unit 33
- 1602 Gladiola St
- 2702 Wildflower Way
- 1606 Gladiola St
- 1604 Gladiola St
- 1604 Gladiola St Unit 1
- 2444 Sunflower Dr
- 0 Wildflower Way Unit 8617403
- 0 Wildflower Way Unit 3115835
- 0 Wildflower Way Unit 9025403
- 0 Wildflower Way Unit 8788053
- 0 Wildflower Way Unit 3270999
- 0 Wildflower Way Unit 7246168
- 0 Wildflower Way Unit 7514778
- 0 Wildflower Way Unit 8011784
- 0 Wildflower Way Unit 8040830