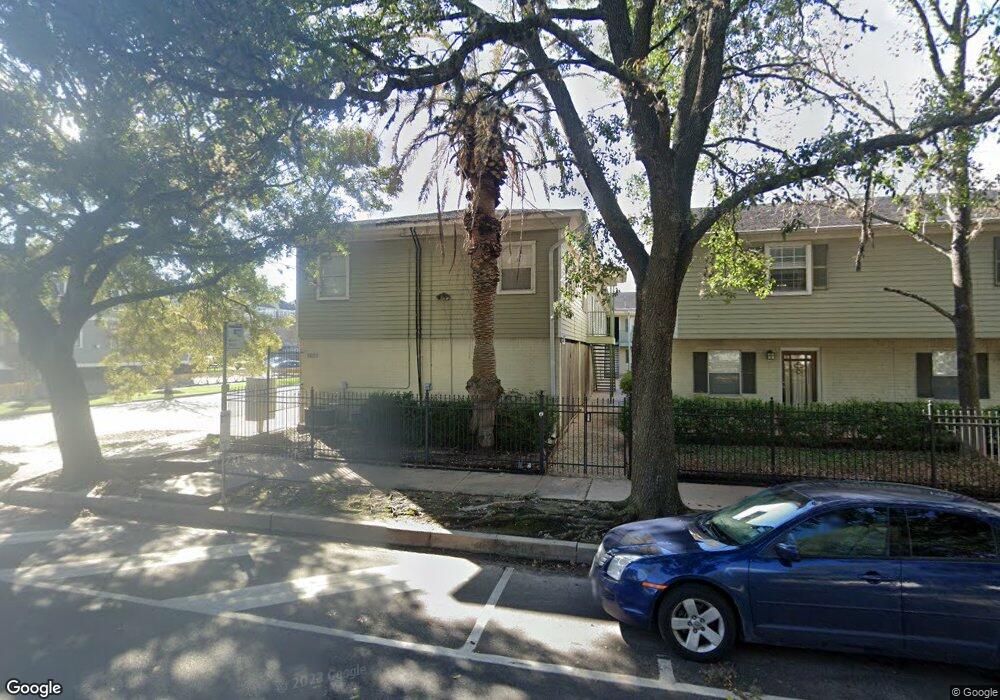
1603 Heights Blvd Unit 13 Houston, TX 77008
Greater Heights NeighborhoodEstimated Value: $222,144 - $242,000
2
Beds
1
Bath
888
Sq Ft
$265/Sq Ft
Est. Value
About This Home
This home is located at 1603 Heights Blvd Unit 13, Houston, TX 77008 and is currently estimated at $235,036, approximately $264 per square foot. 1603 Heights Blvd Unit 13 is a home located in Harris County with nearby schools including Helms Elementary School, Hamilton Middle, and Heights High School.
Ownership History
Date
Name
Owned For
Owner Type
Purchase Details
Closed on
Oct 26, 2010
Sold by
Federal Home Loan Mortgage Corporation
Bought by
Montana Belinda
Current Estimated Value
Home Financials for this Owner
Home Financials are based on the most recent Mortgage that was taken out on this home.
Original Mortgage
$106,600
Outstanding Balance
$70,154
Interest Rate
4.22%
Mortgage Type
New Conventional
Estimated Equity
$164,882
Purchase Details
Closed on
Jul 6, 2010
Sold by
Harrison Cycette
Bought by
Federal Home Loan Mortgage Corp
Purchase Details
Closed on
Oct 26, 2001
Sold by
Shadow Pines Apartments Ltd
Bought by
Fegen Lance William
Home Financials for this Owner
Home Financials are based on the most recent Mortgage that was taken out on this home.
Original Mortgage
$63,900
Interest Rate
6.59%
Create a Home Valuation Report for This Property
The Home Valuation Report is an in-depth analysis detailing your home's value as well as a comparison with similar homes in the area
Home Values in the Area
Average Home Value in this Area
Purchase History
| Date | Buyer | Sale Price | Title Company |
|---|---|---|---|
| Montana Belinda | -- | First American Title | |
| Federal Home Loan Mortgage Corp | $101,532 | None Available | |
| Fegen Lance William | -- | -- |
Source: Public Records
Mortgage History
| Date | Status | Borrower | Loan Amount |
|---|---|---|---|
| Open | Montana Belinda | $106,600 | |
| Previous Owner | Fegen Lance William | $63,900 | |
| Closed | Fegen Lance William | $11,985 |
Source: Public Records
Tax History Compared to Growth
Tax History
| Year | Tax Paid | Tax Assessment Tax Assessment Total Assessment is a certain percentage of the fair market value that is determined by local assessors to be the total taxable value of land and additions on the property. | Land | Improvement |
|---|---|---|---|---|
| 2025 | $318 | $224,737 | $42,700 | $182,037 |
| 2024 | $318 | $201,030 | $38,196 | $162,834 |
| 2023 | $318 | $211,852 | $40,252 | $171,600 |
| 2022 | $4,076 | $206,650 | $39,264 | $167,386 |
| 2021 | $3,923 | $168,302 | $31,977 | $136,325 |
| 2020 | $4,076 | $168,302 | $31,977 | $136,325 |
| 2019 | $4,259 | $168,302 | $31,977 | $136,325 |
| 2018 | $3,122 | $168,302 | $31,977 | $136,325 |
| 2017 | $4,256 | $168,302 | $31,977 | $136,325 |
| 2016 | $4,256 | $168,302 | $31,977 | $136,325 |
| 2015 | $2,952 | $168,302 | $31,977 | $136,325 |
| 2014 | $2,952 | $168,302 | $31,977 | $136,325 |
Source: Public Records
Map
Nearby Homes
- 128 W 17th St
- 1528 Allston St
- 1439 Yale St
- 1811 Harvard St
- 1535 Rutland St
- 1527 Rutland St Unit 3
- 1436 Harvard St
- 1639 Arlington St
- 1819 Cortlandt St
- 1847 Harvard St
- 105 E 14th St
- 1611 Columbia St
- 1505 Tulane St
- 1847 Cortlandt St
- 1342 Allston St
- 1335 Yale St
- 1512 Ashland St
- 523 W 15th St
- 1333 Yale St
- 1425 Tulane St
- 1603 Heights Blvd Unit 1
- 1603 Heights Blvd Unit 2
- 1603 Heights Blvd Unit 9
- 1603 Heights Blvd Unit 12
- 1603 Heights Blvd Unit 10
- 1603 Heights Blvd Unit 14
- 1603 Heights Blvd Unit 3
- 1603 Heights Blvd Unit 7
- 1603 Heights Blvd Unit 15
- 1603 Heights Blvd Unit 6
- 1603 Heights Blvd Unit 4
- 1603 Heights Blvd Unit 11
- 1603 Heights Blvd Unit 5
- 1605 Heights Blvd
- 121 W 16th St
- 1545 Heights Blvd
- 1602 Yale St
- 125 W 16th St
- 1612 Yale St
- 1614 Yale St