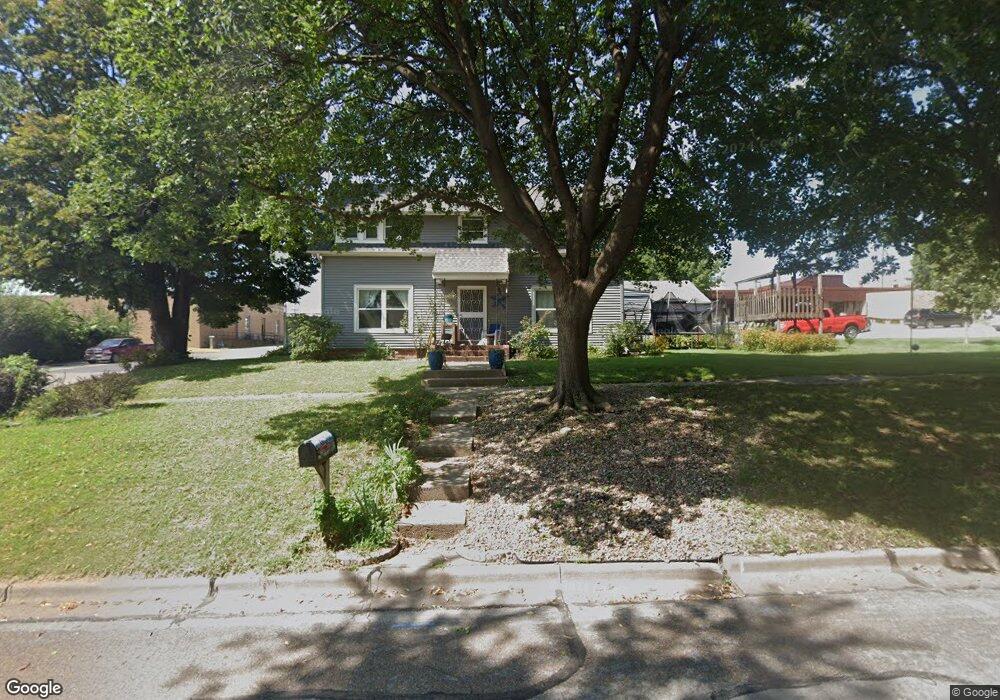
1603 Lane St Falls City, NE 68355
Estimated Value: $127,512 - $181,000
5
Beds
2
Baths
2,900
Sq Ft
$52/Sq Ft
Est. Value
About This Home
This home is located at 1603 Lane St, Falls City, NE 68355 and is currently estimated at $150,628, approximately $51 per square foot. 1603 Lane St is a home located in Richardson County with nearby schools including Falls City North Elementary School, Falls City South Elementary School, and Falls City Middle School.
Ownership History
Date
Name
Owned For
Owner Type
Purchase Details
Closed on
Aug 7, 2006
Sold by
Birdsell Jr Bobby R and Birdsell Jr Candy M
Bought by
Kirkendall Carolyn J
Current Estimated Value
Purchase Details
Closed on
Mar 14, 2006
Sold by
Brennan Terry J
Bought by
Birdsley Jr Bobby R and Birdsley Jr Candy M
Purchase Details
Closed on
Aug 16, 2005
Sold by
Breychak Mary Jane Brennan
Bought by
Brennan Terry J
Create a Home Valuation Report for This Property
The Home Valuation Report is an in-depth analysis detailing your home's value as well as a comparison with similar homes in the area
Home Values in the Area
Average Home Value in this Area
Purchase History
| Date | Buyer | Sale Price | Title Company |
|---|---|---|---|
| Kirkendall Carolyn J | $80,000 | -- | |
| Birdsley Jr Bobby R | $78,000 | -- | |
| Brennan Terry J | -- | -- |
Source: Public Records
Tax History Compared to Growth
Tax History
| Year | Tax Paid | Tax Assessment Tax Assessment Total Assessment is a certain percentage of the fair market value that is determined by local assessors to be the total taxable value of land and additions on the property. | Land | Improvement |
|---|---|---|---|---|
| 2025 | $1,046 | $101,142 | $4,110 | $97,032 |
| 2024 | $1,046 | $95,650 | $4,110 | $91,540 |
| 2023 | $2,268 | $138,274 | $4,110 | $134,164 |
| 2022 | $2,526 | $131,534 | $2,079 | $129,455 |
| 2021 | $2,273 | $121,322 | $2,079 | $119,243 |
| 2020 | $2,190 | $115,644 | $2,079 | $113,565 |
| 2019 | $2,161 | $112,336 | $2,079 | $110,257 |
| 2018 | $2,120 | $109,125 | $2,079 | $107,046 |
| 2017 | $2,124 | $109,125 | $2,079 | $107,046 |
| 2016 | $2,053 | $106,007 | $2,079 | $103,928 |
| 2015 | $2,060 | $106,007 | $2,079 | $103,928 |
| 2014 | $2,057 | $106,007 | $2,079 | $103,928 |
Source: Public Records
Map
Nearby Homes