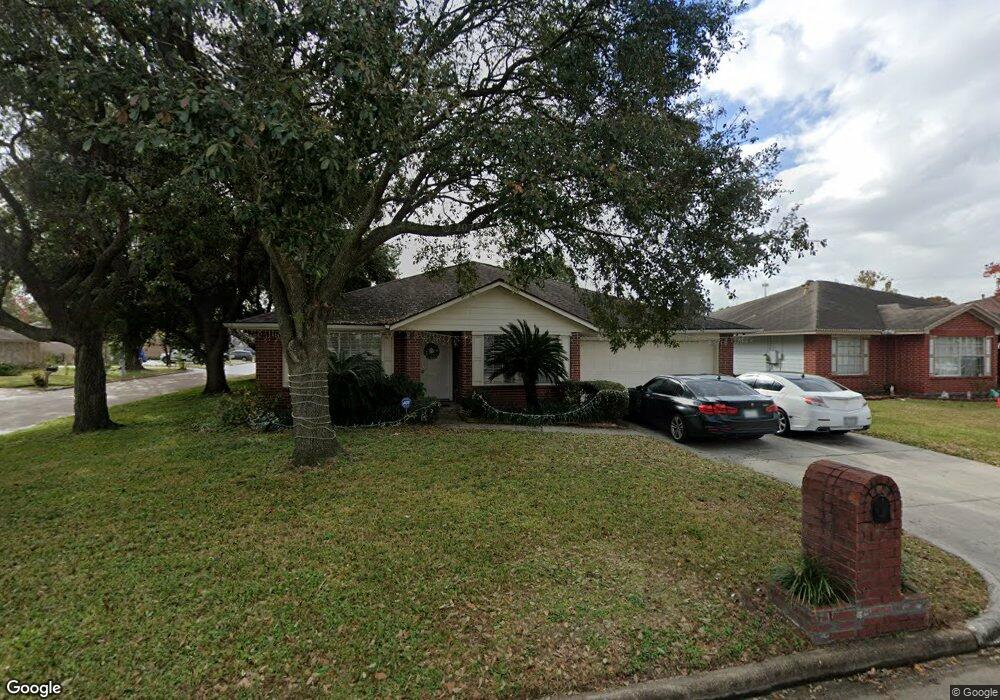
1603 Ruellen Ln Houston, TX 77038
North Houston NeighborhoodEstimated Value: $238,000 - $255,283
3
Beds
2
Baths
2,283
Sq Ft
$108/Sq Ft
Est. Value
About This Home
This home is located at 1603 Ruellen Ln, Houston, TX 77038 and is currently estimated at $246,821, approximately $108 per square foot. 1603 Ruellen Ln is a home located in Harris County with nearby schools including Griggs EC/PK/K, Stehlik Intermediate School, and Stehlik Elementary School.
Ownership History
Date
Name
Owned For
Owner Type
Purchase Details
Closed on
Sep 30, 2013
Sold by
Flores Roque L and Larios Roque
Bought by
Nguyen Si Huu and Tran Van Thanh
Current Estimated Value
Home Financials for this Owner
Home Financials are based on the most recent Mortgage that was taken out on this home.
Original Mortgage
$80,500
Interest Rate
4.46%
Mortgage Type
Purchase Money Mortgage
Purchase Details
Closed on
Jun 16, 1999
Sold by
Parkstone Building Company
Bought by
Flores Roque L
Home Financials for this Owner
Home Financials are based on the most recent Mortgage that was taken out on this home.
Original Mortgage
$59,350
Interest Rate
7.02%
Purchase Details
Closed on
Mar 18, 1999
Sold by
Roanoke Building Company
Bought by
Parkstone Building Company
Create a Home Valuation Report for This Property
The Home Valuation Report is an in-depth analysis detailing your home's value as well as a comparison with similar homes in the area
Home Values in the Area
Average Home Value in this Area
Purchase History
| Date | Buyer | Sale Price | Title Company |
|---|---|---|---|
| Nguyen Si Huu | -- | None Available | |
| Flores Roque L | -- | Commonwealth Land Title Co | |
| Parkstone Building Company | -- | Commonwealth Land Title Co |
Source: Public Records
Mortgage History
| Date | Status | Borrower | Loan Amount |
|---|---|---|---|
| Closed | Nguyen Si Huu | $80,500 | |
| Previous Owner | Flores Roque L | $59,350 |
Source: Public Records
Tax History Compared to Growth
Tax History
| Year | Tax Paid | Tax Assessment Tax Assessment Total Assessment is a certain percentage of the fair market value that is determined by local assessors to be the total taxable value of land and additions on the property. | Land | Improvement |
|---|---|---|---|---|
| 2025 | $343 | $234,095 | $32,930 | $201,165 |
| 2024 | $343 | $234,095 | $32,930 | $201,165 |
| 2023 | $343 | $236,850 | $32,930 | $203,920 |
| 2022 | $3,997 | $203,241 | $22,599 | $180,642 |
| 2021 | $3,789 | $190,065 | $22,599 | $167,466 |
| 2020 | $3,668 | $190,065 | $22,599 | $167,466 |
| 2019 | $3,468 | $172,578 | $22,599 | $149,979 |
| 2018 | $863 | $155,129 | $21,630 | $133,499 |
| 2017 | $2,777 | $107,805 | $13,559 | $94,246 |
| 2016 | $2,777 | $107,805 | $13,559 | $94,246 |
| 2015 | $2,781 | $107,805 | $13,559 | $94,246 |
| 2014 | $2,781 | $107,805 | $13,559 | $94,246 |
Source: Public Records
Map
Nearby Homes
- 00 Fallbrook Dr
- 1327 Fallbrook Dr
- 10519 Pleasanton Dr
- 10558 Pleasanton Dr
- 0 W Mt Houston Rd Unit 90464120
- 1219 Pilot Point Dr
- 2203 Chalet Rd
- 1019 Castolan Dr
- 2115 Havencrest Dr
- 1138 Cherry Spring Dr
- 2530 Woodtown Dr
- 1022 Progreso Dr
- 2614 Lemonwood Ln
- 939 Point Blank Dr
- 1506 Wilshire Park Dr
- 2719 Magnolia Hill Trail
- 12718 Sai Baba Dr
- 1010 Francitas Dr
- 1006 Fruitvale Dr
- 1812 N Sam Houston Pkwy W
- 1607 Ruellen Ln
- 1602 Homebrook Dr
- 1606 Homebrook Dr
- 1611 Ruellen Ln
- 10578 Silver Oak Ln
- 10574 Silver Oak Ln
- 1610 Homebrook Dr
- 1602 Ruellen Ln
- 1518 Ruellen Ln
- 10570 Silver Oak Ln
- 1606 Ruellen Ln
- 1615 Ruellen Ln
- 1514 Ruellen Ln
- 1610 Ruellen Ln
- 1614 Homebrook Dr
- 10566 Silver Oak Ln
- 1510 Ruellen Ln
- 1703 Ruellen Ln
- 10579 Berclair Dr
- 10575 Berclair Dr