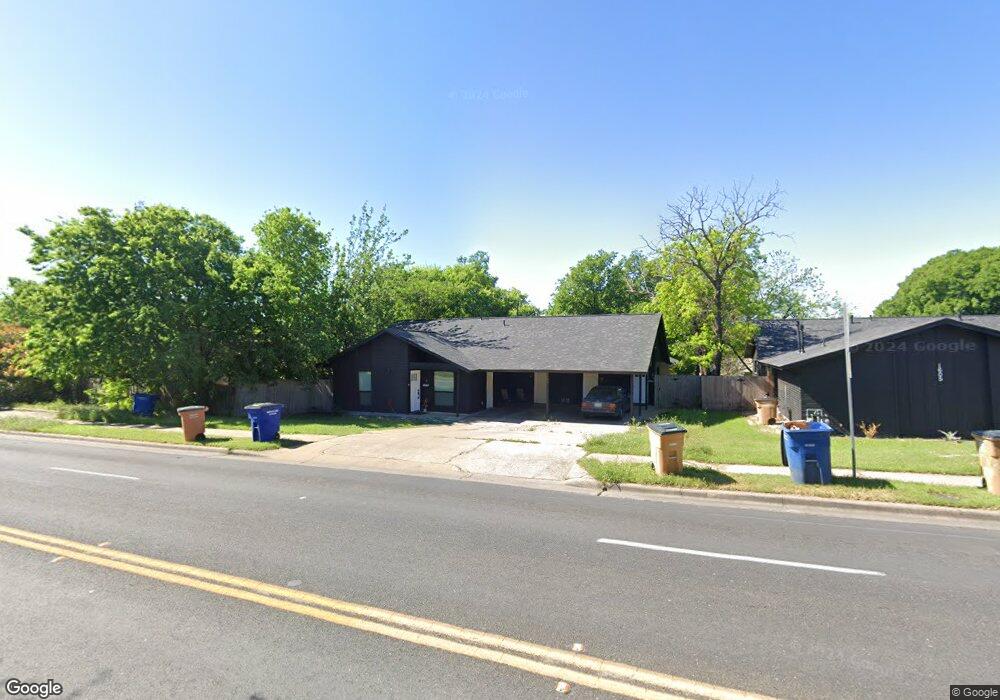
1603 Rutland Dr Unit 1 Austin, TX 78758
North Austin NeighborhoodEstimated Value: $422,000 - $697,000
2
Beds
2
Baths
992
Sq Ft
$538/Sq Ft
Est. Value
About This Home
This home is located at 1603 Rutland Dr Unit 1, Austin, TX 78758 and is currently estimated at $533,796, approximately $538 per square foot. 1603 Rutland Dr Unit 1 is a home located in Travis County with nearby schools including Padron Elementary School, Burnet Middle School, and Navarro Early College High School.
Ownership History
Date
Name
Owned For
Owner Type
Purchase Details
Closed on
Nov 2, 2022
Sold by
Doors Development Gold Llc
Bought by
Maloba Bova
Current Estimated Value
Home Financials for this Owner
Home Financials are based on the most recent Mortgage that was taken out on this home.
Original Mortgage
$455,000
Outstanding Balance
$440,233
Interest Rate
6.7%
Mortgage Type
New Conventional
Estimated Equity
$93,563
Purchase Details
Closed on
May 18, 2022
Sold by
Equity Cash Offer Llc
Bought by
Doors Development Gold Llc
Home Financials for this Owner
Home Financials are based on the most recent Mortgage that was taken out on this home.
Original Mortgage
$509,500
Interest Rate
5.3%
Mortgage Type
New Conventional
Purchase Details
Closed on
May 12, 2022
Sold by
Flo-Shep Interests Ltd
Bought by
Equity Cash Offer Llc
Home Financials for this Owner
Home Financials are based on the most recent Mortgage that was taken out on this home.
Original Mortgage
$509,500
Interest Rate
5.3%
Mortgage Type
New Conventional
Create a Home Valuation Report for This Property
The Home Valuation Report is an in-depth analysis detailing your home's value as well as a comparison with similar homes in the area
Home Values in the Area
Average Home Value in this Area
Purchase History
| Date | Buyer | Sale Price | Title Company |
|---|---|---|---|
| Maloba Bova | -- | -- | |
| Doors Development Gold Llc | -- | New Title Company Name | |
| Equity Cash Offer Llc | -- | New Title Company Name |
Source: Public Records
Mortgage History
| Date | Status | Borrower | Loan Amount |
|---|---|---|---|
| Open | Maloba Bova | $455,000 | |
| Previous Owner | Doors Development Gold Llc | $509,500 |
Source: Public Records
Tax History Compared to Growth
Tax History
| Year | Tax Paid | Tax Assessment Tax Assessment Total Assessment is a certain percentage of the fair market value that is determined by local assessors to be the total taxable value of land and additions on the property. | Land | Improvement |
|---|---|---|---|---|
| 2025 | $11,534 | $546,052 | $211,581 | $334,471 |
| 2023 | $10,576 | $584,574 | $261,250 | $323,324 |
| 2022 | $10,629 | $538,173 | $261,250 | $276,923 |
| 2021 | $7,805 | $358,580 | $118,750 | $239,830 |
| 2020 | $6,771 | $315,700 | $118,750 | $196,950 |
| 2018 | $6,443 | $291,000 | $118,750 | $172,250 |
| 2017 | $4,752 | $213,072 | $71,250 | $141,822 |
| 2016 | $4,084 | $183,141 | $60,000 | $123,141 |
| 2015 | $3,071 | $175,254 | $20,000 | $155,254 |
| 2014 | $3,071 | $142,308 | $20,000 | $122,308 |
Source: Public Records
Map
Nearby Homes
- 9506 Mountain Quail Rd
- 9634 Chukar Cir
- 9308 Singing Quail Dr
- 9614 Newfoundland Cir
- 9228 Partridge Cir
- 1704 Colony Creek Dr
- 9215 Hunters Trace E
- 10005 Quail Hutch Dr
- 1207 W Rundberg Ln
- 1337 Neans Dr
- 10103 Oak Hollow Cir
- 8900 Briardale Dr
- 8906 Trone Cir Unit A
- 2018 W Rundberg Ln Unit 9B
- 2018 W Rundberg Ln Unit 6C
- 10212 W Rutland Village
- 1400 Cripple Creek Dr
- 10219 W Rutland Village
- 8906 Parkfield Dr Unit C
- 9007 Quail Valley Dr
- 1603 Rutland Dr Unit A
- 1603 Rutland Dr
- 1603 Rutland Dr Unit B
- 1603 Rutland Dr Unit A
- 1605 Rutland Dr Unit A
- 1605 Rutland Dr Unit B
- 1605 Rutland Dr
- 1601 Rutland Dr Unit A
- 1601 Rutland Dr Unit B
- 1601 Rutland Dr
- 9416 Mountain Quail Rd
- 1607 Rutland Dr Unit A
- 1607 Rutland Dr Unit B
- 1607 Rutland Dr
- 1607 Rutland Dr Unit A & B
- 9426 Meadow Vale
- 9414 Mountain Quail Rd
- 9500 Mountain Quail Rd
- 1609 Rutland Dr Unit A