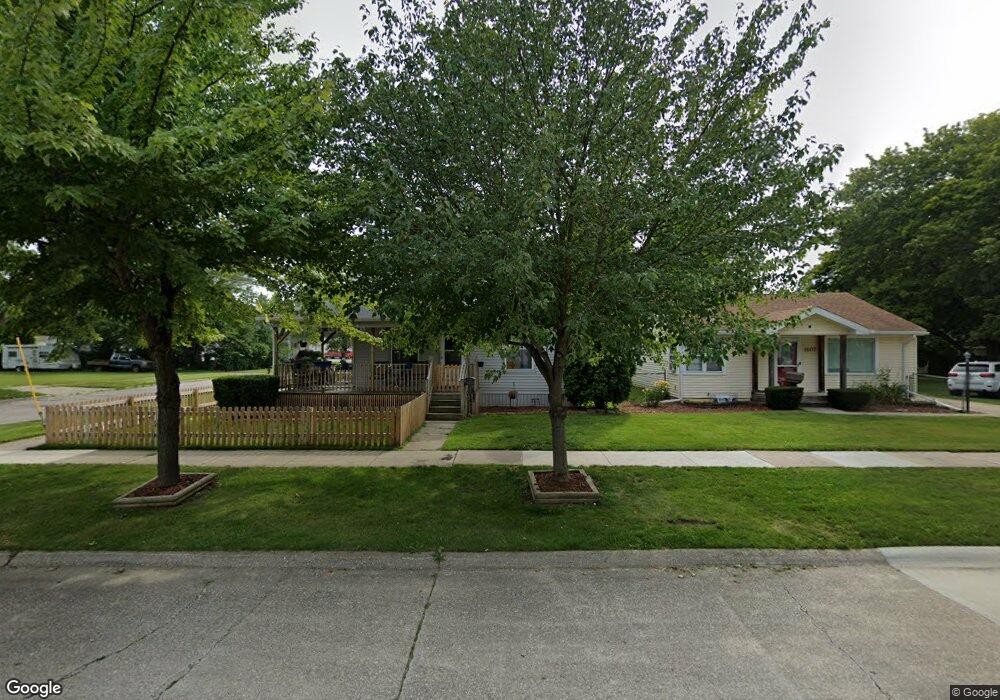
1603 Van Buren St Saginaw, MI 48602
Estimated Value: $52,000 - $79,000
3
Beds
1
Bath
1,467
Sq Ft
$48/Sq Ft
Est. Value
About This Home
This home is located at 1603 Van Buren St, Saginaw, MI 48602 and is currently estimated at $70,414, approximately $47 per square foot. 1603 Van Buren St is a home located in Saginaw County with nearby schools including Herig Elementary School, Thompson Middle School, and Arthur Hill High School.
Ownership History
Date
Name
Owned For
Owner Type
Purchase Details
Closed on
Aug 17, 2000
Sold by
Cruce Michael Ray
Bought by
Galarno Ii Francis P
Current Estimated Value
Home Financials for this Owner
Home Financials are based on the most recent Mortgage that was taken out on this home.
Original Mortgage
$40,100
Interest Rate
8.26%
Mortgage Type
Stand Alone First
Purchase Details
Closed on
Aug 16, 2000
Sold by
Cruce Michael Ray
Bought by
Galarno Ii Francis P
Home Financials for this Owner
Home Financials are based on the most recent Mortgage that was taken out on this home.
Original Mortgage
$40,100
Interest Rate
8.26%
Mortgage Type
Stand Alone First
Purchase Details
Closed on
Apr 12, 1994
Sold by
Hutchison Robert G and Hutchison Deborah K
Bought by
Cruce Michael Ray
Purchase Details
Closed on
Feb 24, 1994
Sold by
Zietz Robert O and Zietz Myrtle J
Bought by
Hutchison Robert G and Hutchison Deborah K
Create a Home Valuation Report for This Property
The Home Valuation Report is an in-depth analysis detailing your home's value as well as a comparison with similar homes in the area
Home Values in the Area
Average Home Value in this Area
Purchase History
| Date | Buyer | Sale Price | Title Company |
|---|---|---|---|
| Galarno Ii Francis P | $30,000 | -- | |
| Galarno Francis P | $30,000 | Lawyers Title Ins Corp | |
| Galarno Ii Francis P | $30,000 | -- | |
| Cruce Michael Ray | $28,900 | -- | |
| Hutchison Robert G | -- | -- |
Source: Public Records
Mortgage History
| Date | Status | Borrower | Loan Amount |
|---|---|---|---|
| Closed | Galarno Francis P | $40,100 | |
| Closed | Galarno Francis P | $5,000 |
Source: Public Records
Tax History Compared to Growth
Tax History
| Year | Tax Paid | Tax Assessment Tax Assessment Total Assessment is a certain percentage of the fair market value that is determined by local assessors to be the total taxable value of land and additions on the property. | Land | Improvement |
|---|---|---|---|---|
| 2025 | $1,344 | $36,600 | $0 | $0 |
| 2024 | $1,020 | $33,100 | $0 | $0 |
| 2023 | $1,247 | $29,200 | $0 | $0 |
| 2022 | $1,238 | $24,600 | $0 | $0 |
| 2021 | $1,380 | $21,400 | $0 | $0 |
| 2020 | $1,225 | $21,400 | $0 | $0 |
| 2019 | $1,006 | $19,900 | $500 | $19,400 |
| 2018 | $805 | $21,742 | $0 | $0 |
| 2017 | $1,015 | $21,800 | $0 | $0 |
| 2016 | $1,208 | $21,869 | $0 | $0 |
| 2014 | -- | $21,426 | $0 | $20,806 |
| 2013 | -- | $21,427 | $0 | $0 |
Source: Public Records
Map
Nearby Homes
- 1617 Van Buren St
- 310 S Bates St
- 1323 Mackinaw St
- 1420 Adams St
- 1404 Birney St
- 1315 Adams St
- 227 Storch St
- 713 S Woodbridge St
- 714 Yale St
- 703 S Mason St
- 1203 Mackinaw St
- 2105 Mackinaw St
- 1403 Cypress St
- 254 Lockwood St
- 1425 Cypress St
- 129 S Oakley St
- 1118 Cass St
- 1515 Beech St
- 809 S Mason St
- 616 S Oakley St
- 1607 Van Buren St
- 411 S Andre St
- 1611 Van Buren St
- 415 S Andre St
- 321 S Andre St
- 1602 Mackinaw St
- 1610 Van Buren St
- 402 S Andre St
- 1623 Van Buren St
- 1610 Mackinaw St
- 1522 Mackinaw St
- 1616 Mackinaw St
- 1620 Van Buren St
- 1516 Mackinaw St
- 1620 Mackinaw St
- 309 S Andre St
- 312 S Charles St
- 1508 Van Buren St
- 413 S Charles St
- 405 S Charles St