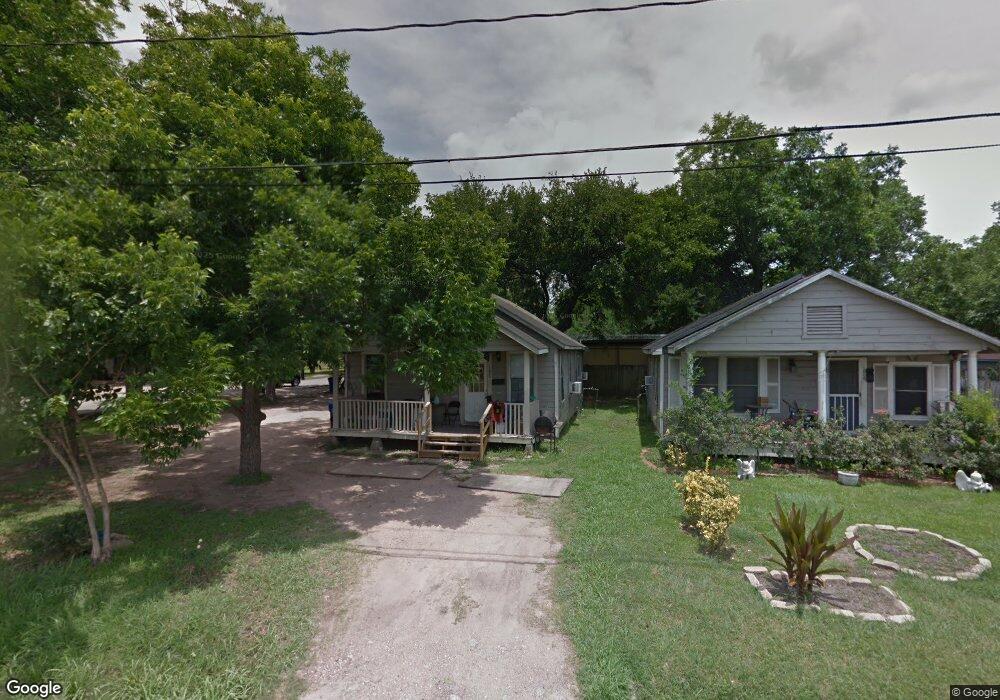
1603 Walnut Ave Unit 2 Rosenberg, TX 77471
Estimated Value: $129,284 - $142,000
1
Bed
1
Bath
720
Sq Ft
$189/Sq Ft
Est. Value
About This Home
This home is located at 1603 Walnut Ave Unit 2, Rosenberg, TX 77471 and is currently estimated at $136,095, approximately $189 per square foot. 1603 Walnut Ave Unit 2 is a home located in Fort Bend County with nearby schools including Travis Elementary School, George Junior High School, and B.F. Terry High School.
Ownership History
Date
Name
Owned For
Owner Type
Purchase Details
Closed on
Oct 23, 2025
Sold by
Vega Lidice Perez
Bought by
Chelvam Rabin
Current Estimated Value
Home Financials for this Owner
Home Financials are based on the most recent Mortgage that was taken out on this home.
Original Mortgage
$110,000
Outstanding Balance
$110,000
Interest Rate
6.35%
Mortgage Type
New Conventional
Estimated Equity
$26,095
Purchase Details
Closed on
Jan 16, 2003
Sold by
Uribe Jose
Bought by
Frank Johnson Properties Llc
Create a Home Valuation Report for This Property
The Home Valuation Report is an in-depth analysis detailing your home's value as well as a comparison with similar homes in the area
Home Values in the Area
Average Home Value in this Area
Purchase History
| Date | Buyer | Sale Price | Title Company |
|---|---|---|---|
| Chelvam Rabin | -- | Frontier Title Company | |
| Frank Johnson Properties Llc | -- | -- |
Source: Public Records
Mortgage History
| Date | Status | Borrower | Loan Amount |
|---|---|---|---|
| Open | Chelvam Rabin | $110,000 |
Source: Public Records
Tax History
| Year | Tax Paid | Tax Assessment Tax Assessment Total Assessment is a certain percentage of the fair market value that is determined by local assessors to be the total taxable value of land and additions on the property. | Land | Improvement |
|---|---|---|---|---|
| 2025 | $1,794 | $79,939 | $25,607 | $54,332 |
| 2024 | $1,794 | $94,960 | $25,607 | $69,353 |
| 2023 | $1,794 | $89,482 | $19,184 | $70,298 |
| 2022 | $1,709 | $83,450 | $19,180 | $64,270 |
| 2021 | $1,285 | $61,910 | $19,180 | $42,730 |
| 2020 | $1,297 | $61,110 | $19,180 | $41,930 |
| 2019 | $1,283 | $56,160 | $13,700 | $42,460 |
| 2018 | $1,109 | $47,760 | $7,440 | $40,320 |
| 2017 | $1,087 | $46,570 | $7,440 | $39,130 |
| 2016 | $1,088 | $46,620 | $7,440 | $39,180 |
| 2015 | $1,098 | $46,800 | $7,440 | $39,360 |
| 2014 | $1,123 | $47,270 | $7,440 | $39,830 |
Source: Public Records
Map
Nearby Homes
Your Personal Tour Guide
Ask me questions while you tour the home.