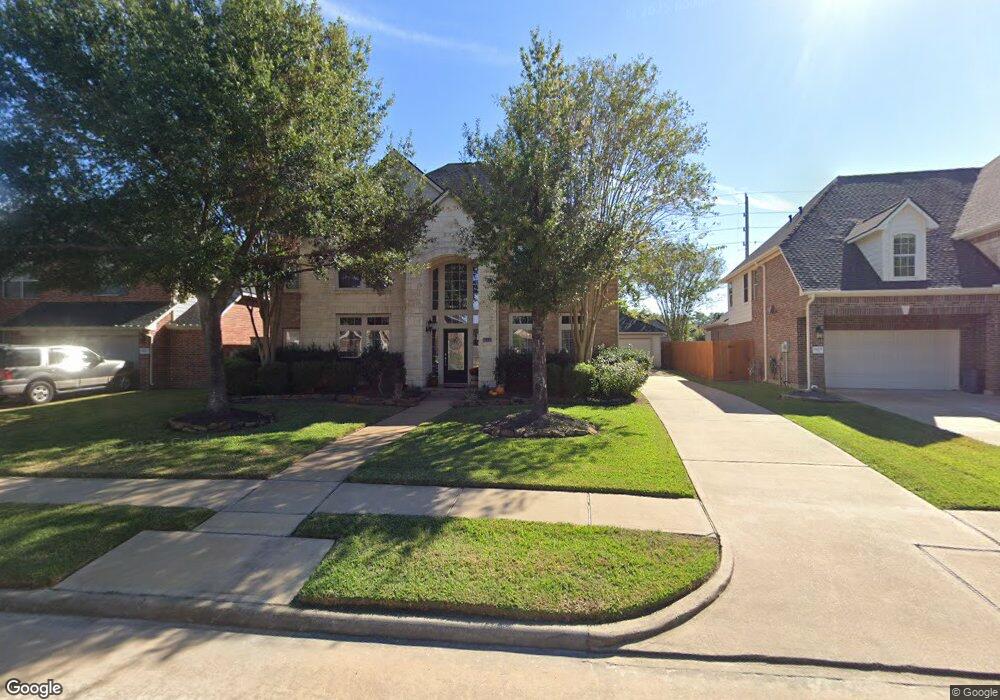
16031 Snowny Hills Dr Cypress, TX 77429
Estimated Value: $532,000 - $578,000
4
Beds
4
Baths
3,345
Sq Ft
$164/Sq Ft
Est. Value
About This Home
This home is located at 16031 Snowny Hills Dr, Cypress, TX 77429 and is currently estimated at $549,252, approximately $164 per square foot. 16031 Snowny Hills Dr is a home located in Harris County with nearby schools including Sampson Elementary School, Spillane Middle School, and Cypress Woods High School.
Ownership History
Date
Name
Owned For
Owner Type
Purchase Details
Closed on
Apr 3, 2006
Sold by
Martinez Donnie and Martinez Delynn
Bought by
Debruin Scott and Debruin Angela
Current Estimated Value
Home Financials for this Owner
Home Financials are based on the most recent Mortgage that was taken out on this home.
Original Mortgage
$42,450
Interest Rate
6.22%
Mortgage Type
Fannie Mae Freddie Mac
Purchase Details
Closed on
Nov 1, 2005
Sold by
Perry Homes
Bought by
Martinez Donnie and Martinez Delynn
Home Financials for this Owner
Home Financials are based on the most recent Mortgage that was taken out on this home.
Original Mortgage
$210,550
Interest Rate
6.25%
Mortgage Type
Fannie Mae Freddie Mac
Purchase Details
Closed on
May 18, 2005
Sold by
Jdc/Greenleaf Ltd
Bought by
Perry Homes
Create a Home Valuation Report for This Property
The Home Valuation Report is an in-depth analysis detailing your home's value as well as a comparison with similar homes in the area
Home Values in the Area
Average Home Value in this Area
Purchase History
| Date | Buyer | Sale Price | Title Company |
|---|---|---|---|
| Debruin Scott | -- | Chicago Title Insurance Co | |
| Martinez Donnie | -- | Chicago Title | |
| Perry Homes | -- | Chicago Title |
Source: Public Records
Mortgage History
| Date | Status | Borrower | Loan Amount |
|---|---|---|---|
| Closed | Debruin Scott | $42,450 | |
| Open | Debruin Scott | $226,400 | |
| Previous Owner | Martinez Donnie | $210,550 |
Source: Public Records
Tax History Compared to Growth
Tax History
| Year | Tax Paid | Tax Assessment Tax Assessment Total Assessment is a certain percentage of the fair market value that is determined by local assessors to be the total taxable value of land and additions on the property. | Land | Improvement |
|---|---|---|---|---|
| 2025 | $7,397 | $481,311 | $103,580 | $377,731 |
| 2024 | $7,397 | $463,923 | $94,204 | $369,719 |
| 2023 | $7,397 | $489,362 | $94,204 | $395,158 |
| 2022 | $10,010 | $420,040 | $67,416 | $352,624 |
| 2021 | $9,831 | $388,432 | $67,416 | $321,016 |
| 2020 | $9,218 | $353,289 | $49,387 | $303,902 |
| 2019 | $9,082 | $337,530 | $49,387 | $288,143 |
| 2018 | $3,599 | $343,679 | $49,387 | $294,292 |
| 2017 | $9,249 | $343,679 | $49,387 | $294,292 |
| 2016 | $10,039 | $373,012 | $49,387 | $323,625 |
| 2015 | $6,904 | $373,012 | $49,387 | $323,625 |
| 2014 | $6,904 | $308,329 | $49,387 | $258,942 |
Source: Public Records
Map
Nearby Homes
- 15923 Hurstfield Pointe Dr
- 15922 Clipper Pointe Dr
- 14126 Bloomingdale Manor Dr
- 14103 Sherburn Manor Dr
- 13926 Wessex Park Dr
- 13002 Huffmeister Rd
- 13718 Sherburn Manor Dr
- 14210 Northface Manor Ct
- 16211 Halpren Falls Ln
- 14210 Prospect Point Dr
- 16219 Haden Crest Ct
- 14207 Spindle Arbor Rd
- 13703 Layton Hills Dr
- 14442 Gleaming Rose Dr
- 16306 Bontura St
- 14539 Gleaming Rose Dr
- 14314 Prosper Ridge Dr
- 13611 Monteigne Ln
- 14015 Halprin Creek Dr
- 16342 Granite Park Ct
- 16027 Snowny Hills Dr
- 16035 Snowny Hills Dr
- 16051 Snowy Hills Dr
- 16018 Lockdale Ln
- 16023 Snowny Hills Dr
- 16039 Snowny Hills Dr
- 16022 Lockdale Ln
- 16034 Snowny Hills Dr
- 16030 Snowny Hills Dr
- 16026 Lockdale Ln
- 16043 Snowny Hills Dr
- 16014 Lockdale Ln
- 16038 Snowny Hills Dr
- 16026 Snowny Hills Dr
- 16022 Snowny Hills Dr
- 16042 Snowny Hills Dr
- 16030 Lockdale Ln
- 16047 Snowny Hills Dr
- 16015 Snowny Hills Dr
- 16031 Closewood Terrace Dr