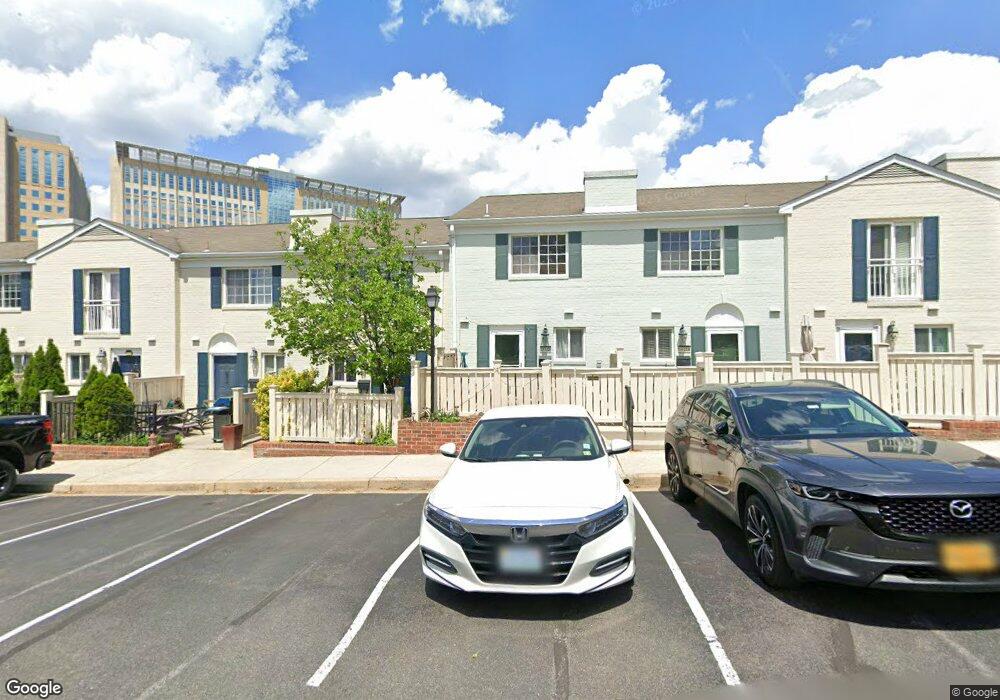
1603B N Van Dorn St Alexandria, VA 22304
Seminary Hill NeighborhoodEstimated Value: $357,000 - $358,000
1
Bed
1
Bath
1,070
Sq Ft
$334/Sq Ft
Est. Value
About This Home
This home is located at 1603B N Van Dorn St, Alexandria, VA 22304 and is currently estimated at $357,432, approximately $334 per square foot. 1603B N Van Dorn St is a home located in Alexandria City with nearby schools including James K. Polk Elementary School, Francis C. Hammond Middle, and Alexandria City High School.
Ownership History
Date
Name
Owned For
Owner Type
Purchase Details
Closed on
May 28, 2021
Sold by
Pulliam Raevon M
Bought by
Sierra Angela
Current Estimated Value
Home Financials for this Owner
Home Financials are based on the most recent Mortgage that was taken out on this home.
Original Mortgage
$262,400
Outstanding Balance
$237,940
Interest Rate
3%
Mortgage Type
Purchase Money Mortgage
Estimated Equity
$119,492
Purchase Details
Closed on
Nov 29, 2016
Sold by
Cabacungan Roderick A
Bought by
Pulliam Raevon M
Home Financials for this Owner
Home Financials are based on the most recent Mortgage that was taken out on this home.
Original Mortgage
$235,000
Interest Rate
3.52%
Mortgage Type
New Conventional
Purchase Details
Closed on
Oct 31, 2008
Sold by
Fisher Tammy
Bought by
Cabacungan Roderick A
Home Financials for this Owner
Home Financials are based on the most recent Mortgage that was taken out on this home.
Original Mortgage
$245,410
Interest Rate
5.83%
Mortgage Type
New Conventional
Create a Home Valuation Report for This Property
The Home Valuation Report is an in-depth analysis detailing your home's value as well as a comparison with similar homes in the area
Home Values in the Area
Average Home Value in this Area
Purchase History
| Date | Buyer | Sale Price | Title Company |
|---|---|---|---|
| Sierra Angela | $329,000 | Title Resources Guaranty Co | |
| Pulliam Raevon M | $250,000 | Logan Title | |
| Cabacungan Roderick A | $253,000 | -- |
Source: Public Records
Mortgage History
| Date | Status | Borrower | Loan Amount |
|---|---|---|---|
| Open | Sierra Angela | $262,400 | |
| Previous Owner | Pulliam Raevon M | $235,000 | |
| Previous Owner | Cabacungan Roderick A | $245,410 |
Source: Public Records
Tax History Compared to Growth
Tax History
| Year | Tax Paid | Tax Assessment Tax Assessment Total Assessment is a certain percentage of the fair market value that is determined by local assessors to be the total taxable value of land and additions on the property. | Land | Improvement |
|---|---|---|---|---|
| 2025 | $3,565 | $329,703 | $107,621 | $222,082 |
| 2024 | $3,565 | $306,315 | $98,757 | $207,558 |
| 2023 | $3,400 | $306,315 | $98,757 | $207,558 |
| 2022 | $3,223 | $290,346 | $93,608 | $196,738 |
| 2021 | $2,984 | $268,838 | $86,674 | $182,164 |
| 2020 | $2,801 | $252,430 | $81,384 | $171,046 |
| 2019 | $2,672 | $236,468 | $76,238 | $160,230 |
| 2018 | $2,620 | $231,832 | $74,743 | $157,089 |
| 2017 | $2,568 | $227,286 | $73,278 | $154,008 |
| 2016 | $2,439 | $227,286 | $73,278 | $154,008 |
| 2015 | $2,371 | $227,286 | $73,278 | $154,008 |
| 2014 | $2,290 | $219,600 | $70,800 | $148,800 |
Source: Public Records
Map
Nearby Homes
- 1637 N Van Dorn St
- 1657 B N Van Dorn St
- 1573 N Van Dorn St Unit A
- 1335 N Pegram St
- 5443 Richenbacher Ave
- 1101 Finley Ln
- 2406 Gretter Place
- 2411 Gorgas Place
- 957 N Paxton St
- 4654 Lawton Way
- 4667 Longstreet Ln Unit 105
- 2643 Centennial Ct
- 4688 Lawton Way Unit 3
- 4691 Longstreet Ln Unit 202
- 4659 Lambert Dr
- 2356 Garnett Dr Unit 1
- 4663 Lambert Dr
- 4532 Peacock Ave
- 505 N Naylor St
- 4628 Knight Place
- 1603 van Dorn Street B N Unit 1603B
- 1603 N Van Dorn St Unit 1603A
- 1603 N Van Dorn St Unit 1603B
- 1603A N Van Dorn St
- 1603 N Van Dorn St
- 1603 N Van Dorn St Unit B
- 1609 N Van Dorn St
- 1609 N Van Dorn St Unit A
- 1611B N Van Dorn St
- 1611A N Van Dorn St
- 1609B N Van Dorn St
- 1609A N Van Dorn St
- 1611 B N Van Dorn St
- 1611 B N Van Dorn St Unit B
- 1609 N Van Dorn St Unit B
- 1611 N Van Dorn St
- 1611 N Van Dorn St Unit A
- 1611 N Van Dorn St Unit B
- 1613B N Van Dorn St
- 1613A N Van Dorn St