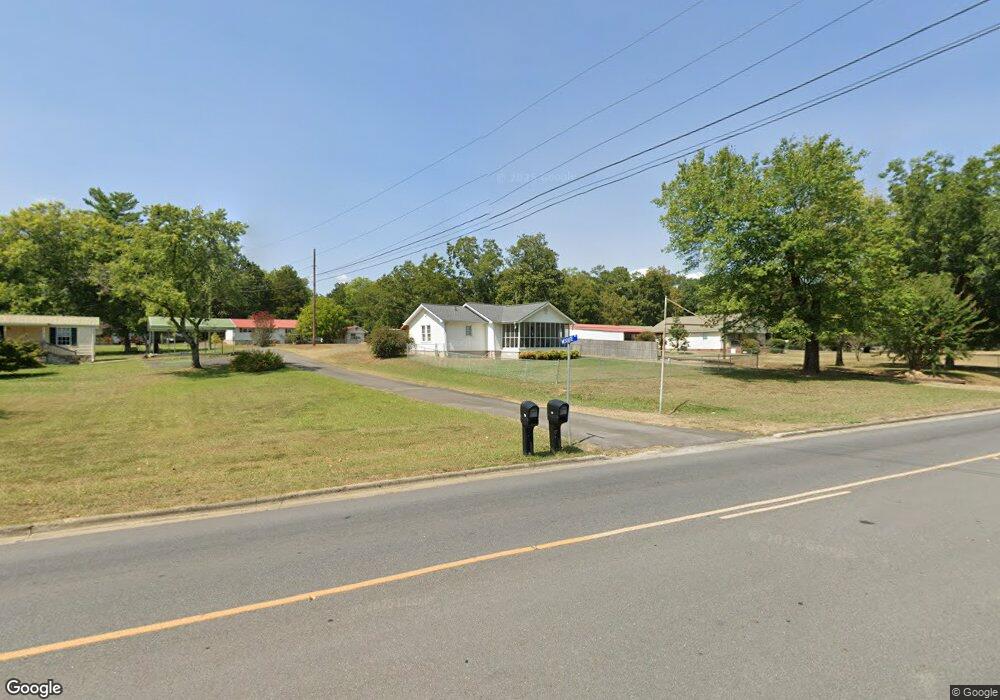
1604 Antioch Rd Dalton, GA 30721
Estimated Value: $134,398 - $215,000
--
Bed
--
Bath
1,162
Sq Ft
$146/Sq Ft
Est. Value
About This Home
This home is located at 1604 Antioch Rd, Dalton, GA 30721 and is currently estimated at $169,100, approximately $145 per square foot. 1604 Antioch Rd is a home with nearby schools including Eastside Elementary School, Eastbrook Middle School, and Southeast Whitfield County High School.
Ownership History
Date
Name
Owned For
Owner Type
Purchase Details
Closed on
Jan 15, 2016
Sold by
Phillips James Ronnie
Bought by
Nelson Debra Ann and Nelson William David
Current Estimated Value
Home Financials for this Owner
Home Financials are based on the most recent Mortgage that was taken out on this home.
Original Mortgage
$63,771
Outstanding Balance
$50,768
Interest Rate
3.99%
Mortgage Type
FHA
Estimated Equity
$118,332
Purchase Details
Closed on
Dec 31, 2015
Sold by
Diane Cynthia
Bought by
Phillip James Ronnie
Home Financials for this Owner
Home Financials are based on the most recent Mortgage that was taken out on this home.
Original Mortgage
$63,771
Outstanding Balance
$50,768
Interest Rate
3.99%
Mortgage Type
FHA
Estimated Equity
$118,332
Purchase Details
Closed on
Jan 5, 2015
Sold by
Phillips James Ronnie
Bought by
Phillips James Ronnie and Phillips Irene
Purchase Details
Closed on
Sep 1, 1993
Bought by
Phillips Arnold and Phillips Sue
Create a Home Valuation Report for This Property
The Home Valuation Report is an in-depth analysis detailing your home's value as well as a comparison with similar homes in the area
Home Values in the Area
Average Home Value in this Area
Purchase History
| Date | Buyer | Sale Price | Title Company |
|---|---|---|---|
| Nelson Debra Ann | $65,000 | -- | |
| Phillip James Ronnie | -- | -- | |
| Phillips James Ronnie | -- | -- | |
| Philips James Ronnie | -- | -- | |
| Phillips James Ronnie | -- | -- | |
| Phillips Arnold | $36,000 | -- |
Source: Public Records
Mortgage History
| Date | Status | Borrower | Loan Amount |
|---|---|---|---|
| Open | Nelson Debra Ann | $63,771 |
Source: Public Records
Tax History Compared to Growth
Tax History
| Year | Tax Paid | Tax Assessment Tax Assessment Total Assessment is a certain percentage of the fair market value that is determined by local assessors to be the total taxable value of land and additions on the property. | Land | Improvement |
|---|---|---|---|---|
| 2024 | $872 | $51,192 | $3,314 | $47,878 |
| 2023 | $872 | $29,033 | $1,205 | $27,828 |
| 2022 | $669 | $22,674 | $1,205 | $21,469 |
| 2021 | $669 | $22,674 | $1,205 | $21,469 |
| 2020 | $692 | $22,674 | $1,205 | $21,469 |
| 2019 | $703 | $22,674 | $1,205 | $21,469 |
| 2018 | $712 | $22,609 | $1,140 | $21,469 |
| 2017 | $713 | $22,609 | $1,140 | $21,469 |
| 2016 | $628 | $20,169 | $593 | $19,576 |
| 2014 | $549 | $20,378 | $802 | $19,576 |
| 2013 | -- | $20,378 | $802 | $19,575 |
Source: Public Records
Map
Nearby Homes
- 1712 Wendell St
- Lot 3 Riverbend Rd
- Lot 2 Riverbend Rd
- 945 Riverbend Rd
- Lot 4 Liberty Dr
- Lot 10 Liberty Dr
- Lot 9 Liberty Dr
- 11 Liberty St
- 1401 Eastbrook Rd SE
- 1320 Coker Dr
- 1412 Stevenson Dr
- 1302 Jackson Rd
- 1007 Locke Dr
- 171 Bear Den Ct
- 1401 Eastbrook Dr SE
- Lot 5 River Bend Rd
- Lot 4 Riverbend Rd
- Lot 7 Riverbend Rd
- 1629 Roosevelt Dr
- trac 2 Roosevelt Dr