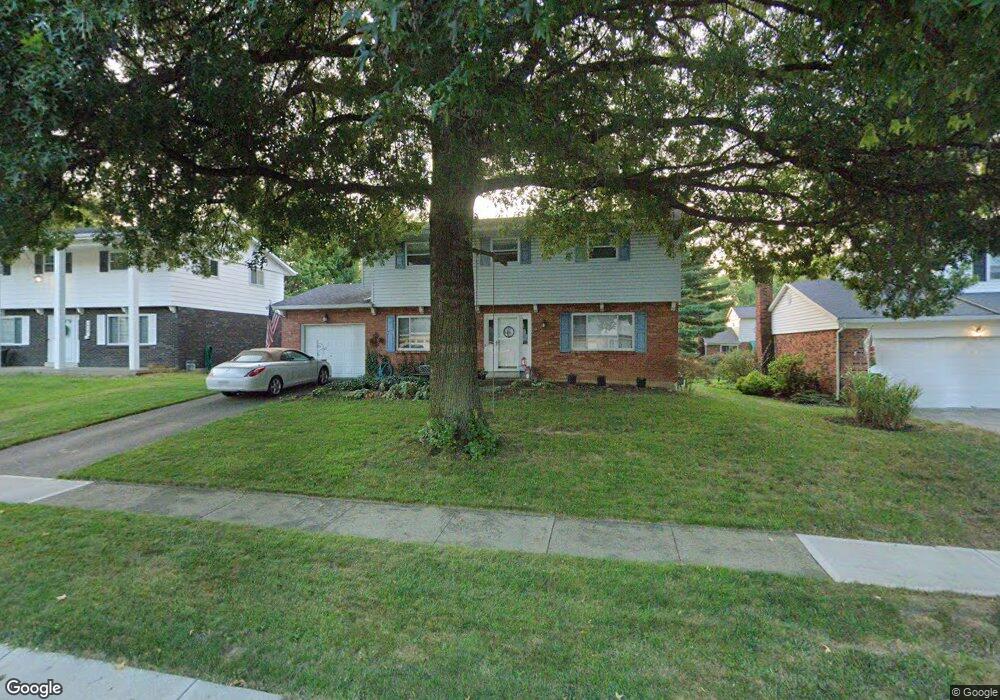
1604 Citadel Place Cincinnati, OH 45255
Estimated Value: $302,000 - $373,000
4
Beds
3
Baths
1,813
Sq Ft
$186/Sq Ft
Est. Value
About This Home
This home is located at 1604 Citadel Place, Cincinnati, OH 45255 and is currently estimated at $337,399, approximately $186 per square foot. 1604 Citadel Place is a home located in Hamilton County with nearby schools including Summit Elementary School, Nagel Middle School, and Anderson High School.
Ownership History
Date
Name
Owned For
Owner Type
Purchase Details
Closed on
Jan 30, 2002
Sold by
Humphreys Patti D
Bought by
Castleman Michael J and Castleman Gloria A
Current Estimated Value
Home Financials for this Owner
Home Financials are based on the most recent Mortgage that was taken out on this home.
Original Mortgage
$115,120
Outstanding Balance
$48,206
Interest Rate
7.24%
Estimated Equity
$289,193
Purchase Details
Closed on
Dec 23, 1999
Sold by
Randolph Jackson H and Randolph Angelina
Bought by
Humphreys Patti D
Home Financials for this Owner
Home Financials are based on the most recent Mortgage that was taken out on this home.
Original Mortgage
$103,200
Interest Rate
7.69%
Purchase Details
Closed on
Oct 8, 1999
Sold by
Kammerer Edward J and Kammerer Janet R
Bought by
Randolph Jackson H and Randolph Angelina
Create a Home Valuation Report for This Property
The Home Valuation Report is an in-depth analysis detailing your home's value as well as a comparison with similar homes in the area
Home Values in the Area
Average Home Value in this Area
Purchase History
| Date | Buyer | Sale Price | Title Company |
|---|---|---|---|
| Castleman Michael J | $143,900 | -- | |
| Humphreys Patti D | $129,000 | -- | |
| Randolph Jackson H | $128,500 | -- |
Source: Public Records
Mortgage History
| Date | Status | Borrower | Loan Amount |
|---|---|---|---|
| Open | Castleman Michael J | $115,120 | |
| Closed | Humphreys Patti D | $103,200 |
Source: Public Records
Tax History Compared to Growth
Tax History
| Year | Tax Paid | Tax Assessment Tax Assessment Total Assessment is a certain percentage of the fair market value that is determined by local assessors to be the total taxable value of land and additions on the property. | Land | Improvement |
|---|---|---|---|---|
| 2024 | $5,413 | $89,012 | $13,979 | $75,033 |
| 2023 | $5,149 | $89,012 | $13,979 | $75,033 |
| 2022 | $4,093 | $62,973 | $12,149 | $50,824 |
| 2021 | $3,996 | $62,973 | $12,149 | $50,824 |
| 2020 | $4,042 | $62,973 | $12,149 | $50,824 |
| 2019 | $3,940 | $55,727 | $10,752 | $44,975 |
| 2018 | $3,691 | $55,727 | $10,752 | $44,975 |
| 2017 | $3,482 | $55,727 | $10,752 | $44,975 |
| 2016 | $3,118 | $48,731 | $10,539 | $38,192 |
| 2015 | $3,028 | $48,731 | $10,539 | $38,192 |
| 2014 | $3,030 | $48,731 | $10,539 | $38,192 |
| 2013 | $2,924 | $49,725 | $10,752 | $38,973 |
Source: Public Records
Map
Nearby Homes
- 1624 Pinebluff Ln
- 8557 Linderwood Ln
- 4172 Brandonmore Dr
- 8486 Bethany Ln
- 1797 Muskegon Dr
- 1728 Rockhurst Ln
- 471 Sanctuary Way
- 473 Sanctuary Way
- 475 Sanctuary Way
- 477 Sanctuary Way
- 477 Sanctuary Way Unit 23
- 4077 Mclean Dr
- 1450 Tonopah Dr
- 498 Sanctuary Way
- 496 Sanctuary Way
- 494 Sanctuary Way
- 492 Sanctuary Way
- 490 Sanctuary Way
- 488 Sanctuary Way
- 486 Sanctuary Way
- 1596 Citadel Place
- 1612 Citadel Place
- 1611 Laval Dr
- 1622 Citadel Place
- 1586 Citadel Place
- 1595 Laval Dr
- 1621 Laval Dr
- 1601 Citadel Place
- 1609 Citadel Place
- 1585 Laval Dr
- 1593 Citadel Place
- 1578 Citadel Place
- 1630 Citadel Place
- 1621 Citadel Place
- 1629 Laval Dr
- 1577 Laval Dr
- 1583 Citadel Place
- 1629 Citadel Place
- 1570 Citadel Place
- 1638 Citadel Place