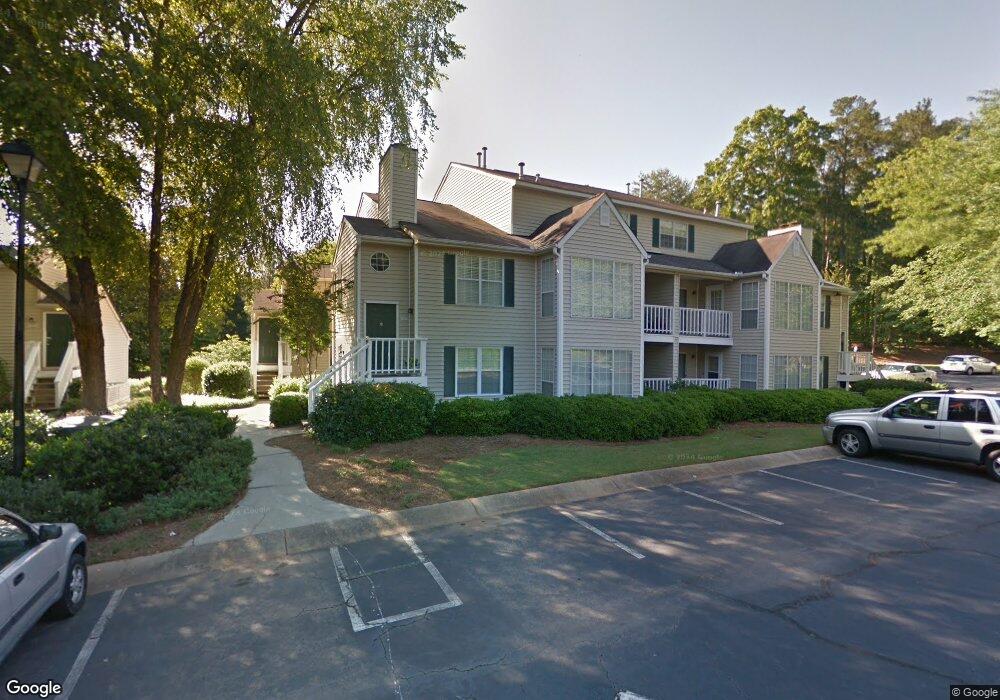
1604 Glenleaf Dr Peachtree Corners, GA 30092
Estimated Value: $185,619 - $203,000
1
Bed
1
Bath
936
Sq Ft
$206/Sq Ft
Est. Value
About This Home
This home is located at 1604 Glenleaf Dr, Peachtree Corners, GA 30092 and is currently estimated at $193,155, approximately $206 per square foot. 1604 Glenleaf Dr is a home located in Gwinnett County with nearby schools including Peachtree Elementary School, Pinckneyville Middle School, and Paul Duke STEM High School.
Ownership History
Date
Name
Owned For
Owner Type
Purchase Details
Closed on
May 15, 2021
Sold by
Gragg Devonshire Condominium Llc
Bought by
Gragg Devonshire Condominium Llc
Current Estimated Value
Purchase Details
Closed on
Dec 9, 2020
Sold by
Armistead Mary Ann
Bought by
Gragg Devonshire Condominium Llc
Purchase Details
Closed on
Mar 8, 2019
Sold by
Crossland Erin
Bought by
Armistead Mary Ann
Purchase Details
Closed on
Aug 8, 2012
Sold by
Worthington Julie A
Bought by
Crossland Erin
Home Financials for this Owner
Home Financials are based on the most recent Mortgage that was taken out on this home.
Original Mortgage
$28,500
Interest Rate
3.55%
Mortgage Type
New Conventional
Purchase Details
Closed on
Nov 10, 1999
Sold by
Ochsner Kristine J
Bought by
Worthington Julie A
Home Financials for this Owner
Home Financials are based on the most recent Mortgage that was taken out on this home.
Original Mortgage
$62,750
Interest Rate
7%
Mortgage Type
New Conventional
Create a Home Valuation Report for This Property
The Home Valuation Report is an in-depth analysis detailing your home's value as well as a comparison with similar homes in the area
Home Values in the Area
Average Home Value in this Area
Purchase History
| Date | Buyer | Sale Price | Title Company |
|---|---|---|---|
| Gragg Devonshire Condominium Llc | -- | -- | |
| Gragg Devonshire Condominium Llc | $132,000 | -- | |
| Armistead Mary Ann | $108,000 | -- | |
| Crossland Erin | $30,000 | -- | |
| Worthington Julie A | $69,800 | -- |
Source: Public Records
Mortgage History
| Date | Status | Borrower | Loan Amount |
|---|---|---|---|
| Previous Owner | Crossland Erin | $28,500 | |
| Previous Owner | Worthington Julie A | $62,750 |
Source: Public Records
Tax History Compared to Growth
Tax History
| Year | Tax Paid | Tax Assessment Tax Assessment Total Assessment is a certain percentage of the fair market value that is determined by local assessors to be the total taxable value of land and additions on the property. | Land | Improvement |
|---|---|---|---|---|
| 2024 | $2,645 | $74,800 | $14,400 | $60,400 |
| 2023 | $2,645 | $68,080 | $11,400 | $56,680 |
| 2022 | $0 | $59,840 | $11,400 | $48,440 |
| 2021 | $1,777 | $48,800 | $8,760 | $40,040 |
| 2020 | $475 | $43,200 | $8,760 | $34,440 |
| 2019 | $927 | $40,520 | $8,000 | $32,520 |
| 2018 | $835 | $36,040 | $6,000 | $30,040 |
| 2016 | $639 | $26,840 | $4,800 | $22,040 |
| 2015 | $588 | $24,440 | $4,000 | $20,440 |
| 2014 | -- | $18,400 | $4,000 | $14,400 |
Source: Public Records
Map
Nearby Homes
- 102 Glenleaf Dr
- 104 Glenleaf Dr
- 1304 Glenleaf Dr
- 1008 Glenleaf Dr
- 513 Glenleaf Dr
- 702 Glenleaf Dr
- 6615 Sienna Ct
- 6630 Harvest Mill
- 3425 September Morn
- 3426 September Morn
- 3263 Hidden Cove Cir Unit 1307
- 3927 Acer Ct
- 3105 Sumac Dr
- 3091 Sumac Dr
- 6600 Ridge Moore Dr
- 6221 Willow Run Rd Unit 6221
- 6614 Meadow Green Cir
- 6220 Brookwood Rd
- 1604 Glenleaf Dr
- 1604 Glenleaf Dr
- 1603 Glenleaf Dr
- 1603 Glenleaf Dr Unit 1603
- 1608 Glenleaf Dr
- 1607 Glenleaf Dr
- 1602 Glenleaf Dr
- 1606 Glenleaf Dr
- 1609 Glenleaf Dr Unit 1609
- 1601 Glenleaf Dr
- 1605 Glenleaf Dr
- 1614 Glenleaf Dr Unit 1614
- 1614 Glenleaf Dr
- 1610 Glenleaf Dr
- 1615 Glenleaf Dr
- 1611 Glenleaf Dr
- 1616 Glenleaf Dr
- 1612 Glenleaf Dr
- 1612 Glenleaf Dr Unit 1612
- 1617 Glenleaf Dr Unit BLDG 16