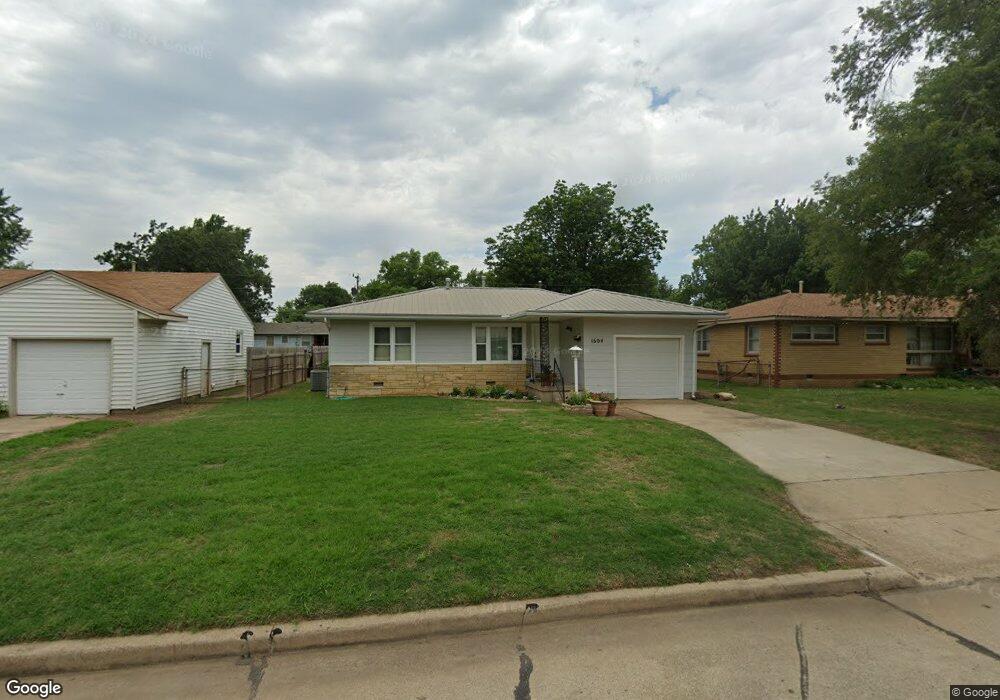
1604 Hudson Dr Ponca City, OK 74601
Estimated Value: $62,000 - $86,000
2
Beds
1
Bath
832
Sq Ft
$90/Sq Ft
Est. Value
About This Home
This home is located at 1604 Hudson Dr, Ponca City, OK 74601 and is currently estimated at $74,647, approximately $89 per square foot. 1604 Hudson Dr is a home located in Kay County with nearby schools including Liberty Elementary School, Ponca City East Middle School, and Ponca City West Middle School.
Ownership History
Date
Name
Owned For
Owner Type
Purchase Details
Closed on
Jan 27, 2010
Sold by
Federal Home Loan Mortgage Corporation
Bought by
Vandusen Robert Van and Vandusen Donna Van
Current Estimated Value
Purchase Details
Closed on
Jul 31, 2007
Sold by
Chambers Shannon L and Chambers Jenette
Bought by
Adams Meagan L
Home Financials for this Owner
Home Financials are based on the most recent Mortgage that was taken out on this home.
Original Mortgage
$42,500
Interest Rate
6.73%
Mortgage Type
New Conventional
Purchase Details
Closed on
Dec 30, 1999
Sold by
Brenda Darin and Brenda Altman
Bought by
Shannon L Chambers
Purchase Details
Closed on
Nov 10, 1999
Sold by
Jerry Alvin and Jerry Altman
Bought by
Brenda Darin and Brenda Altman
Purchase Details
Closed on
Jan 4, 1995
Sold by
Bobby Alvin and Bobby Altman
Bought by
Jerry Alvin and Jerry Altman
Purchase Details
Closed on
Aug 24, 1994
Sold by
Savannah Altman
Bought by
Bobby Alvin and Bobby Altman
Create a Home Valuation Report for This Property
The Home Valuation Report is an in-depth analysis detailing your home's value as well as a comparison with similar homes in the area
Home Values in the Area
Average Home Value in this Area
Purchase History
| Date | Buyer | Sale Price | Title Company |
|---|---|---|---|
| Vandusen Robert Van | $38,500 | -- | |
| Adams Meagan L | $42,500 | -- | |
| Shannon L Chambers | $33,000 | -- | |
| Brenda Darin | -- | -- | |
| Jerry Alvin | $15,000 | -- | |
| Bobby Alvin | $12,000 | -- |
Source: Public Records
Mortgage History
| Date | Status | Borrower | Loan Amount |
|---|---|---|---|
| Previous Owner | Adams Meagan L | $42,500 |
Source: Public Records
Tax History Compared to Growth
Tax History
| Year | Tax Paid | Tax Assessment Tax Assessment Total Assessment is a certain percentage of the fair market value that is determined by local assessors to be the total taxable value of land and additions on the property. | Land | Improvement |
|---|---|---|---|---|
| 2024 | $465 | $4,911 | $570 | $4,341 |
| 2023 | $465 | $4,677 | $570 | $4,107 |
| 2022 | $424 | $4,454 | $570 | $3,884 |
| 2021 | $426 | $4,454 | $570 | $3,884 |
| 2020 | $421 | $4,447 | $570 | $3,877 |
| 2019 | $405 | $4,235 | $570 | $3,665 |
| 2018 | $406 | $4,190 | $570 | $3,620 |
| 2017 | $411 | $4,190 | $570 | $3,620 |
| 2016 | $415 | $4,190 | $570 | $3,620 |
| 2015 | $410 | $4,118 | $570 | $3,548 |
| 2014 | $394 | $4,035 | $570 | $3,465 |
Source: Public Records
Map
Nearby Homes
- 1600 Hudson Dr
- 1608 Hudson Dr
- 1516 Hudson Dr
- 1612 Hudson Dr
- 1605 Potomac Dr
- 1601 Potomac Dr
- 1609 Potomac Dr
- 1512 Hudson Dr
- 1517 Potomac Dr
- 1613 Potomac Dr
- 1605 Hudson Dr
- 1616 Hudson Dr
- 1601 Hudson Dr
- 1609 Hudson Dr
- 1613 Hudson Dr
- 1513 Potomac Dr
- 1517 Hudson Dr
- 1617 Potomac Dr
- 1508 Hudson Dr
- 1700 Hudson Dr