Estimated Value: $172,000 - $199,772
3
Beds
1
Bath
1,371
Sq Ft
$139/Sq Ft
Est. Value
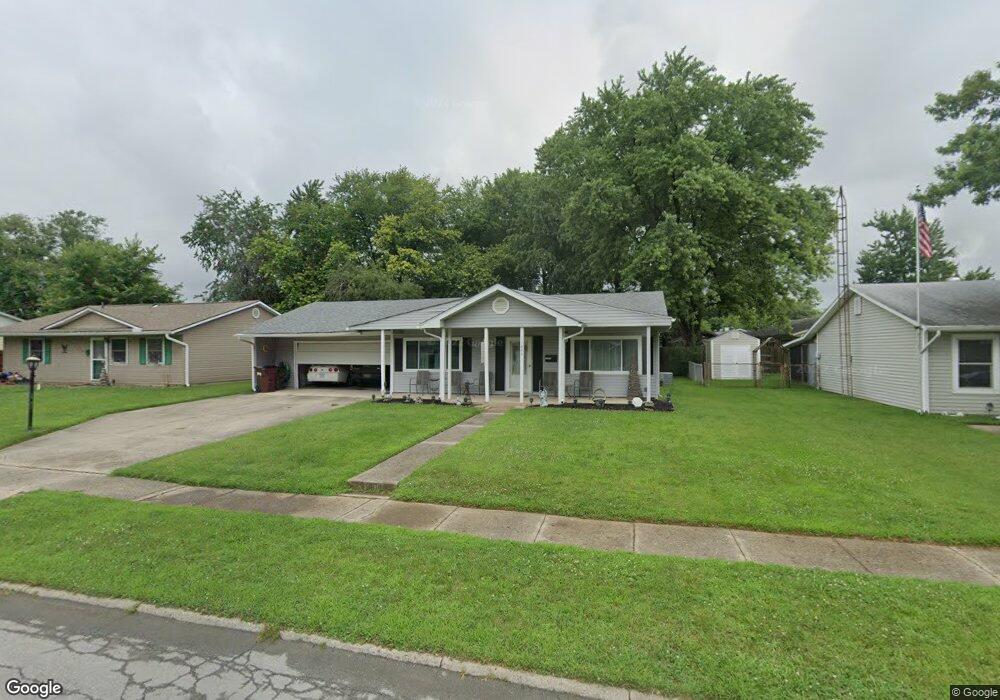
About This Home
This home is located at 1604 Kylemore Dr, Xenia, OH 45385 and is currently estimated at $189,943, approximately $138 per square foot. 1604 Kylemore Dr is a home located in Greene County with nearby schools including Xenia High School, Summit Academy Community School for Alternative Learners - Xenia, and Legacy Christian Academy.
Ownership History
Date
Name
Owned For
Owner Type
Purchase Details
Closed on
Jul 21, 2015
Sold by
Butts Linda K
Bought by
Butts Linda K and Peterson Robert E
Current Estimated Value
Purchase Details
Closed on
May 25, 2007
Sold by
Wray William L
Bought by
Butts Linda K
Home Financials for this Owner
Home Financials are based on the most recent Mortgage that was taken out on this home.
Original Mortgage
$85,000
Outstanding Balance
$51,844
Interest Rate
6.22%
Mortgage Type
Unknown
Estimated Equity
$138,099
Purchase Details
Closed on
Oct 3, 1996
Sold by
Lamka Cynthia
Bought by
Wray William L
Home Financials for this Owner
Home Financials are based on the most recent Mortgage that was taken out on this home.
Original Mortgage
$67,791
Interest Rate
8%
Mortgage Type
FHA
Purchase Details
Closed on
Jun 15, 1994
Sold by
Turner Louis E
Bought by
Huddleson Cynthia
Create a Home Valuation Report for This Property
The Home Valuation Report is an in-depth analysis detailing your home's value as well as a comparison with similar homes in the area
Home Values in the Area
Average Home Value in this Area
Purchase History
| Date | Buyer | Sale Price | Title Company |
|---|---|---|---|
| Butts Linda K | -- | Attorney | |
| Butts Linda K | -- | Attorney | |
| Wray William L | $68,500 | -- | |
| Huddleson Cynthia | $60,000 | -- |
Source: Public Records
Mortgage History
| Date | Status | Borrower | Loan Amount |
|---|---|---|---|
| Open | Butts Linda K | $85,000 | |
| Previous Owner | Wray William L | $67,791 |
Source: Public Records
Tax History Compared to Growth
Tax History
| Year | Tax Paid | Tax Assessment Tax Assessment Total Assessment is a certain percentage of the fair market value that is determined by local assessors to be the total taxable value of land and additions on the property. | Land | Improvement |
|---|---|---|---|---|
| 2024 | $1,794 | $52,830 | $10,010 | $42,820 |
| 2023 | $1,794 | $52,830 | $10,010 | $42,820 |
| 2022 | $1,369 | $36,740 | $7,150 | $29,590 |
| 2021 | $1,387 | $36,740 | $7,150 | $29,590 |
| 2020 | $1,328 | $36,740 | $7,150 | $29,590 |
| 2019 | $944 | $27,480 | $4,850 | $22,630 |
| 2018 | $948 | $27,480 | $4,850 | $22,630 |
| 2017 | $920 | $27,480 | $4,850 | $22,630 |
| 2016 | $854 | $25,320 | $4,850 | $20,470 |
| 2015 | $856 | $25,320 | $4,850 | $20,470 |
| 2014 | $819 | $25,320 | $4,850 | $20,470 |
Source: Public Records
Map
Nearby Homes
- 1144 Rockwell Dr
- 1342 Kylemore Dr
- 1568 Cheyenne Dr
- 1391 June Dr
- 1283 June Dr
- 121 S Progress Dr
- 1233 June Dr
- 1223 June Dr
- 1618 Navajo Dr
- 1653 Seneca Dr
- 1208 Bellbrook Ave
- 1272 Bellbrook Ave
- 1351 Omard Dr
- 1778 Arapaho Dr
- 2758 Wyoming Dr
- 343 Sheelin Rd
- 219 Kansas Dr
- 1769 Gayhart Dr
- 1829 Gayhart Dr
- 912 Omard Dr
- 1618 Kylemore Dr
- 1590 Kylemore Dr
- 1458 Bowman Dr
- 1630 Kylemore Dr
- 1470 Bowman Dr
- 1615 Kylemore Dr
- 1603 Kylemore Dr
- 1627 Kylemore Dr
- 1484 Bowman Dr
- 1591 Kylemore Dr
- 1644 Kylemore Dr
- 1562 Kylemore Dr
- 1641 Kylemore Dr
- 1577 Kylemore Dr
- 281 Ridgebury Dr
- 1457 Bowman Dr
- 271 Ridgebury Dr
- 1496 Bowman Dr
- 1658 Kylemore Dr
- 1469 Bowman Dr