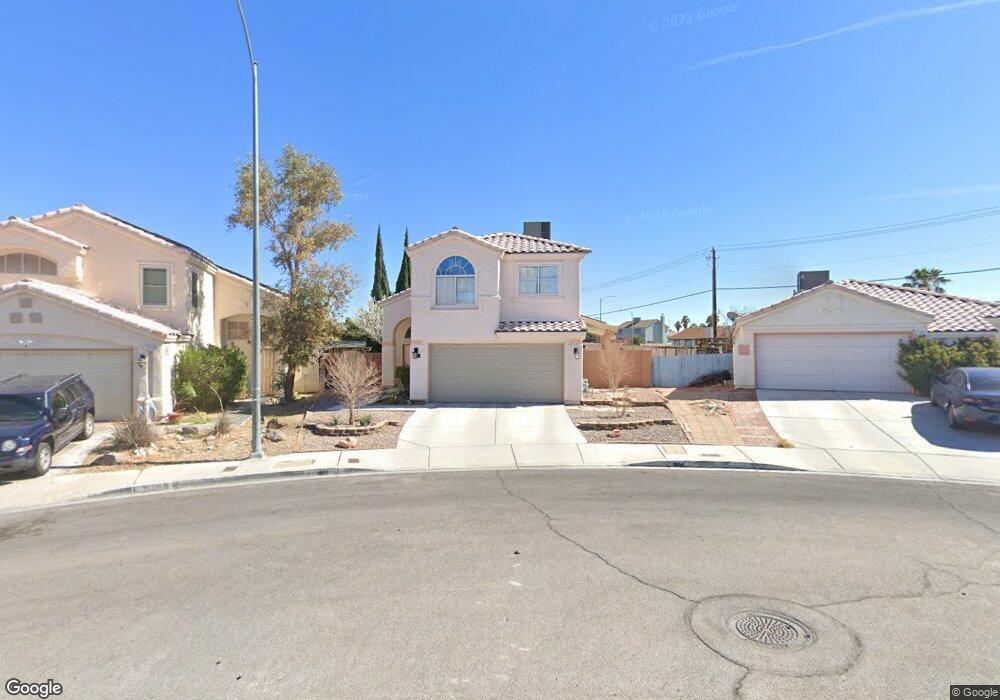
1604 Leaning Pine Way Las Vegas, NV 89128
Michael Way NeighborhoodEstimated Value: $410,000 - $436,000
4
Beds
3
Baths
1,641
Sq Ft
$260/Sq Ft
Est. Value
About This Home
This home is located at 1604 Leaning Pine Way, Las Vegas, NV 89128 and is currently estimated at $426,064, approximately $259 per square foot. 1604 Leaning Pine Way is a home located in Clark County with nearby schools including James B. McMillan Elementary School, Edythe & Lloyd Katz Elementary School, and Ernest Becker Middle School.
Ownership History
Date
Name
Owned For
Owner Type
Purchase Details
Closed on
May 13, 2003
Sold by
Thielen Michael E and Miller Rochelle L
Bought by
Miller Rochelle L and Thielen Michael E
Current Estimated Value
Home Financials for this Owner
Home Financials are based on the most recent Mortgage that was taken out on this home.
Original Mortgage
$134,000
Interest Rate
5.71%
Mortgage Type
Unknown
Purchase Details
Closed on
Mar 14, 2000
Sold by
Hoskin Donahoo Cidney P and Hoskin Cidney P
Bought by
Thielen Michael E and Miller Rochelle L
Home Financials for this Owner
Home Financials are based on the most recent Mortgage that was taken out on this home.
Original Mortgage
$129,985
Interest Rate
8.24%
Mortgage Type
FHA
Purchase Details
Closed on
Jul 8, 1999
Sold by
Hoskin Charles J and Hoskin Cidney P
Bought by
Hoskins Cidney P
Create a Home Valuation Report for This Property
The Home Valuation Report is an in-depth analysis detailing your home's value as well as a comparison with similar homes in the area
Home Values in the Area
Average Home Value in this Area
Purchase History
| Date | Buyer | Sale Price | Title Company |
|---|---|---|---|
| Miller Rochelle L | -- | United Title Of Nevada | |
| Thielen Michael E | $131,500 | Old Republic Title Company | |
| Hoskins Cidney P | -- | -- |
Source: Public Records
Mortgage History
| Date | Status | Borrower | Loan Amount |
|---|---|---|---|
| Closed | Miller Rochelle L | $134,000 | |
| Closed | Thielen Michael E | $129,985 |
Source: Public Records
Tax History Compared to Growth
Tax History
| Year | Tax Paid | Tax Assessment Tax Assessment Total Assessment is a certain percentage of the fair market value that is determined by local assessors to be the total taxable value of land and additions on the property. | Land | Improvement |
|---|---|---|---|---|
| 2025 | $1,987 | $92,662 | $32,200 | $60,462 |
| 2024 | $1,930 | $92,662 | $32,200 | $60,462 |
| 2023 | $1,930 | $87,079 | $29,400 | $57,679 |
| 2022 | $2,051 | $76,999 | $24,850 | $52,149 |
| 2021 | $1,865 | $71,195 | $21,350 | $49,845 |
| 2020 | $1,729 | $70,389 | $20,650 | $49,739 |
| 2019 | $1,620 | $68,089 | $18,900 | $49,189 |
| 2018 | $1,546 | $61,864 | $14,350 | $47,514 |
| 2017 | $2,001 | $61,050 | $12,600 | $48,450 |
| 2016 | $1,448 | $58,871 | $10,150 | $48,721 |
| 2015 | $1,444 | $53,330 | $8,400 | $44,930 |
| 2014 | $1,402 | $41,561 | $6,300 | $35,261 |
Source: Public Records
Map
Nearby Homes
- 1533 Wintergreen Dr
- 1624 Leaning Pine Way
- 7224 Single Pine Dr
- 7228 Single Pine Dr
- 1636 Royal Palm Dr
- 7037 Brown Derby Cir
- 7321 Summer Sun Dr
- 1320 Rainbow Meadows Dr
- 7405 Saybrook Point Dr
- 7400 Queen Palm Dr
- 7104 Carmen Blvd
- 1620 Palmae Way
- 7424 Queen Palm Dr
- 7113 Carrondale Way
- 1724 Navajo Lake Way
- 1428 Pacific Terrace Dr
- 7501 Moon Shower Cir
- 925 Willow Tree Dr Unit B
- 1009 Willow Tree Dr Unit C
- 1028 Willow Tree Dr Unit D
- 1608 Leaning Pine Way
- 1600 Leaning Pine Way
- 1612 Leaning Pine Way
- 7201 Single Pine Dr Unit 2
- 1616 Leaning Pine Way
- 7205 Single Pine Dr
- 7204 Single Pine Dr
- 1620 Leaning Pine Way
- 7209 Single Pine Dr
- 7208 Single Pine Dr
- 1624 Leaning Pine Way Unit n
- 7213 Single Pine Dr
- 7212 Single Pine Dr
- 7212 Single Pine Dr
- 7201 Indian Path Cir
- 7200 Periwinkle Dr
- 7204 Periwinkle Dr
- 7208 Periwinkle Dr
- 1628 Leaning Pine Way
- 7205 Indian Path Cir