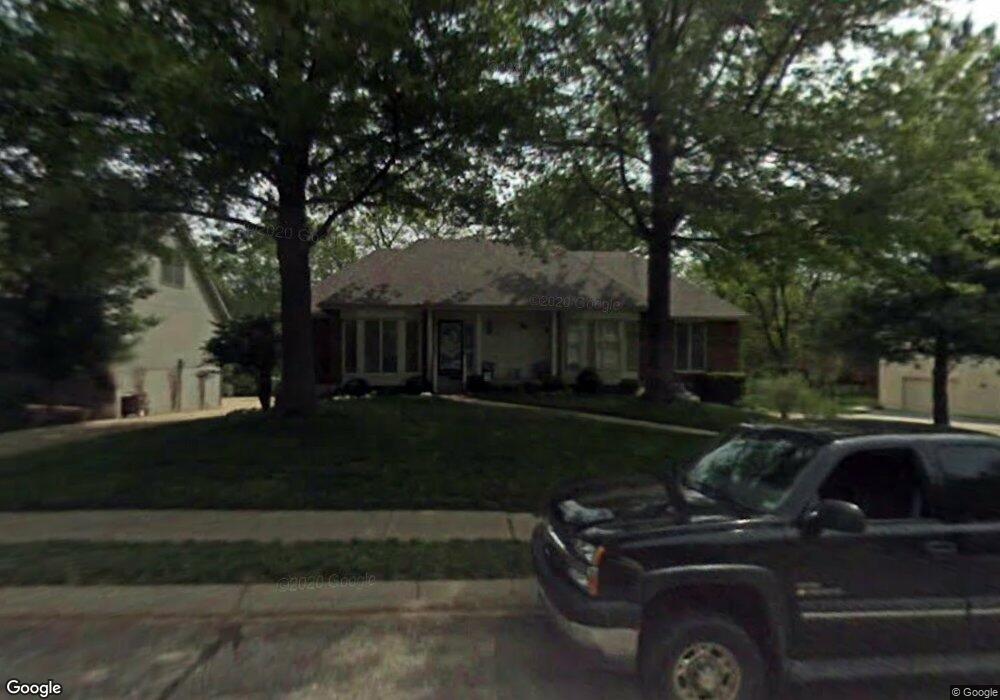
1604 NW Weatherstone Dr Blue Springs, MO 64015
Estimated Value: $289,547 - $350,000
3
Beds
3
Baths
1,812
Sq Ft
$180/Sq Ft
Est. Value
About This Home
This home is located at 1604 NW Weatherstone Dr, Blue Springs, MO 64015 and is currently estimated at $326,637, approximately $180 per square foot. 1604 NW Weatherstone Dr is a home located in Jackson County with nearby schools including James Lewis Elementary School, Brittany Hill Middle School, and Blue Springs High School.
Ownership History
Date
Name
Owned For
Owner Type
Purchase Details
Closed on
May 23, 2019
Sold by
Hammerschmidt Jacinda L
Bought by
Hammerschmidt Jacinda L and Jacinda L Hammerschmidt Living Trust
Current Estimated Value
Purchase Details
Closed on
Jan 4, 2016
Sold by
Hammerschmidt Shane L
Bought by
Hammerschmidt Jacinda L
Purchase Details
Closed on
Dec 8, 2010
Sold by
Wiss Darrell L and Wiss Joyce A
Bought by
Hammerschmidt Shane and Hammerschmidt Jacinda
Home Financials for this Owner
Home Financials are based on the most recent Mortgage that was taken out on this home.
Original Mortgage
$165,690
Outstanding Balance
$109,468
Interest Rate
4.22%
Mortgage Type
FHA
Estimated Equity
$217,169
Purchase Details
Closed on
Oct 14, 2002
Sold by
Wiss Vera Mae
Bought by
Wiss Vera Mae and The Vera Mae Wiss Revocable Living Trust
Purchase Details
Closed on
Nov 6, 1997
Sold by
Wiss Lloyd C and Mae Vera
Bought by
Wiss Darrell Lee and Wolfberg Joyce Ann
Create a Home Valuation Report for This Property
The Home Valuation Report is an in-depth analysis detailing your home's value as well as a comparison with similar homes in the area
Home Values in the Area
Average Home Value in this Area
Purchase History
| Date | Buyer | Sale Price | Title Company |
|---|---|---|---|
| Hammerschmidt Jacinda L | -- | None Available | |
| Hammerschmidt Jacinda L | -- | None Available | |
| Hammerschmidt Shane | -- | Stewart Title | |
| Wiss Vera Mae | -- | -- | |
| Wiss Vera Mae | -- | -- | |
| Wiss Darrell Lee | -- | Ati Title Company |
Source: Public Records
Mortgage History
| Date | Status | Borrower | Loan Amount |
|---|---|---|---|
| Open | Hammerschmidt Shane | $165,690 |
Source: Public Records
Tax History Compared to Growth
Tax History
| Year | Tax Paid | Tax Assessment Tax Assessment Total Assessment is a certain percentage of the fair market value that is determined by local assessors to be the total taxable value of land and additions on the property. | Land | Improvement |
|---|---|---|---|---|
| 2025 | $2,914 | $41,068 | $9,817 | $31,251 |
| 2024 | $2,858 | $35,712 | $6,280 | $29,432 |
| 2023 | $2,858 | $35,713 | $5,993 | $29,720 |
| 2022 | $4,043 | $44,650 | $5,352 | $39,298 |
| 2021 | $4,039 | $44,650 | $5,352 | $39,298 |
| 2020 | $3,470 | $39,025 | $5,352 | $33,673 |
| 2019 | $3,355 | $39,025 | $5,352 | $33,673 |
| 2018 | $3,034 | $33,964 | $4,658 | $29,306 |
| 2017 | $3,034 | $33,964 | $4,658 | $29,306 |
| 2016 | $2,964 | $33,269 | $5,472 | $27,797 |
| 2014 | $2,980 | $33,342 | $5,116 | $28,226 |
Source: Public Records
Map
Nearby Homes
- 1601 NW Weatherstone Ct
- 1513 NW Weatherstone Ct
- 813 NW North Ridge Ct
- 1113 NW Forest Dr
- 1000 NW Forest Dr
- 2100 NW Parker Ct
- 1501 NW 18th St
- 2100 NW 12th St
- 2117 NW Parker Ct
- 908 NW Timber Oak Dr
- 1201 NW Burr Oak Ct
- 1400 NW Deer Run Trail
- 1109 NW Mock Ave
- 1701 NW Duncan Rd
- 2105 NW 5th St
- 1389 NW Jefferson Ct
- 904 NW Oakridge Dr
- 409 NW Locust Dr
- 2412 NW 9th St
- 1912 NW Manor Dr
- 1608 NW Weatherstone Dr
- 1600 NW Weatherstone Dr
- 1612 NW Weatherstone Dr
- 1705 NW 11th Street Ct
- 1605 NW Weatherstone Dr
- 1612 NW Weatherstone Ct
- 1709 NW 11th Street Ct
- 1601 NW Weatherstone Dr
- 1616 NW Weatherstone Dr
- 1513 NW Weatherstone Dr
- 1608 NW Weatherstone Ct
- 1713 NW 11th Street Ct
- 1508 NW Weatherstone Dr
- 1700 NW 11th Street Ct
- 1700 NW 11th Street Ct
- 1613 NW Weatherstone Ct
- 1512 NW Weatherstone Ct
- 1501 NW Weatherstone Dr
- 1505 NW Westwood Dr
- 1700 NW Weatherstone Dr