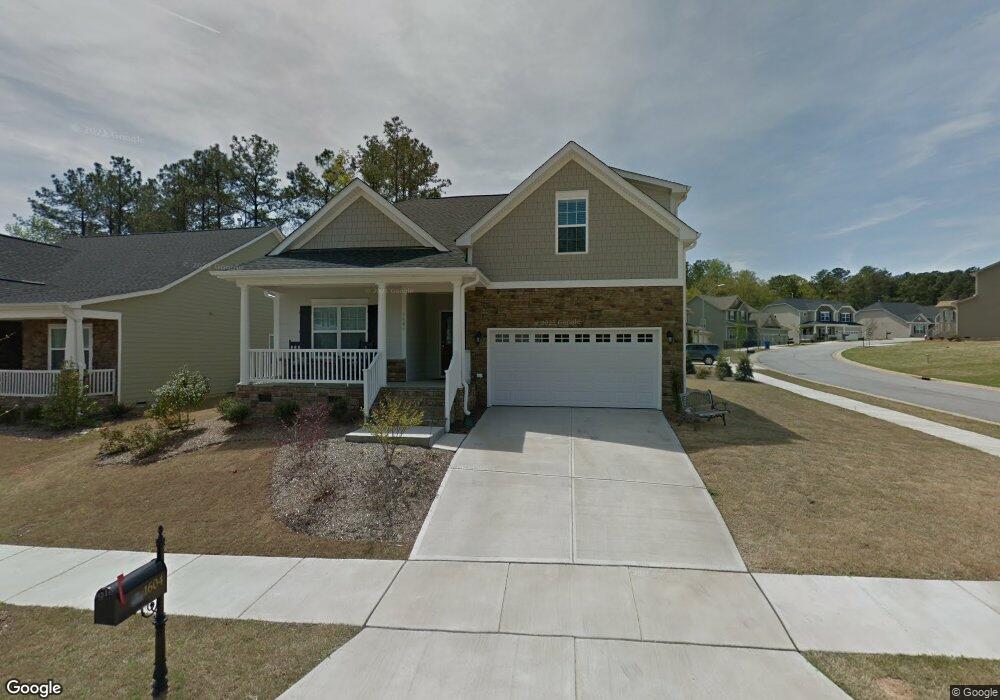
1604 Old Bramble Ln Fuquay Varina, NC 27526
Estimated Value: $433,076 - $474,000
3
Beds
2
Baths
2,031
Sq Ft
$222/Sq Ft
Est. Value
About This Home
This home is located at 1604 Old Bramble Ln, Fuquay Varina, NC 27526 and is currently estimated at $450,519, approximately $221 per square foot. 1604 Old Bramble Ln is a home located in Wake County with nearby schools including Carolina Charter Academy.
Ownership History
Date
Name
Owned For
Owner Type
Purchase Details
Closed on
Oct 9, 2020
Sold by
Kazee Richard A and Kazee Bonnie K
Bought by
Guiditta Mark and Guiditta Jenna
Current Estimated Value
Home Financials for this Owner
Home Financials are based on the most recent Mortgage that was taken out on this home.
Original Mortgage
$232,500
Outstanding Balance
$206,419
Interest Rate
2.8%
Mortgage Type
New Conventional
Estimated Equity
$244,100
Purchase Details
Closed on
Mar 11, 2014
Sold by
Citizens Homes Inc
Bought by
Kazee Richard A and Kazee Bonnie K
Home Financials for this Owner
Home Financials are based on the most recent Mortgage that was taken out on this home.
Original Mortgage
$2,200,006
Interest Rate
4.43%
Mortgage Type
VA
Purchase Details
Closed on
Dec 13, 2011
Sold by
Lakestone Partners Llc
Bought by
Citizens Homes Inc
Create a Home Valuation Report for This Property
The Home Valuation Report is an in-depth analysis detailing your home's value as well as a comparison with similar homes in the area
Home Values in the Area
Average Home Value in this Area
Purchase History
| Date | Buyer | Sale Price | Title Company |
|---|---|---|---|
| Guiditta Mark | $310,000 | None Available | |
| Kazee Richard A | $110,000 | None Available | |
| Citizens Homes Inc | $98,000 | None Available |
Source: Public Records
Mortgage History
| Date | Status | Borrower | Loan Amount |
|---|---|---|---|
| Open | Guiditta Mark | $232,500 | |
| Previous Owner | Kazee Richard A | $2,200,006 |
Source: Public Records
Tax History Compared to Growth
Tax History
| Year | Tax Paid | Tax Assessment Tax Assessment Total Assessment is a certain percentage of the fair market value that is determined by local assessors to be the total taxable value of land and additions on the property. | Land | Improvement |
|---|---|---|---|---|
| 2025 | $3,645 | $414,268 | $95,000 | $319,268 |
| 2024 | $3,630 | $414,268 | $95,000 | $319,268 |
| 2023 | $3,040 | $271,613 | $42,000 | $229,613 |
| 2022 | $2,857 | $271,613 | $42,000 | $229,613 |
| 2021 | $2,723 | $271,613 | $42,000 | $229,613 |
| 2020 | $2,723 | $271,613 | $42,000 | $229,613 |
| 2019 | $2,633 | $226,559 | $42,000 | $184,559 |
| 2018 | $2,482 | $226,559 | $42,000 | $184,559 |
| 2017 | $2,393 | $226,559 | $42,000 | $184,559 |
| 2016 | $2,360 | $226,559 | $42,000 | $184,559 |
| 2015 | $2,534 | $251,522 | $50,000 | $201,522 |
| 2014 | -- | $251,522 | $50,000 | $201,522 |
Source: Public Records
Map
Nearby Homes
- 1633 Lakestone Village Ln
- 1757 Whitbrook Ct
- 410 Stranraer Ct
- 1905 Old Bramble Ln Unit 4
- 1977 Enniscorthy St
- 1912 Fishamble St Unit 20
- Citrine Plan at Lakestone Townhomes
- Sunstone Plan at Lakestone Townhomes
- 1904 Fishamble St
- 1921 Fishamble St
- 1643 Southcross St
- 1909 Fishamble St
- 1909 Fishamble St Unit 16
- 409 Kilcornac Ct
- 526 Cardena School Rd
- 2716 Rindlewood Ct
- 804 Kensley Grove Ln Unit 9
- 806 Kensley Grove Ln
- 806 Kensley Grove Ln Unit 8
- 817 Kensley Grove Ln Unit 16
- 1608 Old Bramble Ln
- 1566 Lake Louise Ln
- 1546 Old Bramble Ln
- 1605 Old Bramble Ln
- 1601 Old Bramble Ln
- 1609 Old Bramble Ln
- 1547 Old Bramble Ln
- 1559 Lake Louise Ln
- 1616 Old Bramble Ln
- 1558 Lake Louise Ln
- 1542 Old Bramble Ln
- 0 Old Bramble Ln Unit 1680561
- 0 Old Bramble Ln Unit 151 TR1680561
- 0 Old Bramble Ln Unit 151
- 1613 Old Bramble Ln
- 1543 Old Bramble Ln
- 1620 Old Bramble Ln
- 1538 Old Bramble Ln
- 1553 Lake Louise Ln
- 1554 Lake Louise Ln